Curated OER
Bias in Statistics
Students work to develop surveys and collect data. They display the data using circle graphs, histograms, box and whisker plots, and scatter plots. Students use multimedia tools to develop a visual presentation to display their data.
Curated OER
How the Environment Affects Our Health
Ninth graders explore how the environment affects health. In this infectious disease lesson, 9th graders investigate what environmental situations cause infections diseases. Students study the symptoms, treatments, prevention, and...
Curated OER
Discussing Non-Fiction Texts
Discuss non-fiction texts and fact and opinion. Learners discuss the features of non-fiction text, identify how to distinguish fact from opinion, and list ways to display information, including graphs, charts, and diagrams. While this is...
Curated OER
Solar Heating in the Himalayas
A fascinating lesson plan on how solar power is utilized by people who live in the Himalayas is here for you. In it, learners perform a case study which will help them understand that solar energy is a renewable resource, that geography...
Curated OER
Where Has It Been? Tracking the Ivory-Billed Woodpecker
By studying the assumed extinction, and subsequent rediscovery of the Ivory-billed Woodpecker, learners use maps and come up with a scenario for the rediscovery of the bird. This incredibly thorough lesson plan is chock-full of...
Curated OER
How Do I Get There? Planning a Safe Route to School
One much-needed skill for young learners is direction giving. Have your class plan and draw a safe route for them to travel from home to school. They will also draw places and items that are in between home and school in order to build a...
Curated OER
Mapping Your Community
Learners define the boundaries of their community by comparing the community's official boundaries with other historical, political, physical, and perceived boundaries of the area and create a community map.
Curated OER
Using Charts and Graphs to Study East Asia's Modern Economy
Students examine East Asia's modern economy. In groups, classmates use the internet to compare the resources, products, and economy of specified countries. After collecting the data, pupils create charts, tables and graphs. They...
Curated OER
Mapping Possible Solutions
Fourth graders propose possible sites for the heart of Florida state capital by mapping collected data onto a Florida state map and recording data in a Travel Log.
Curated OER
Mapping the Ocean Floor
Students study the bottom structure of underwater habitats and how they can be mapped.
Virginia Department of Education
Functions 1
Scholars learn what it means for a relation to be a function and see various representations of functions. After learning the definition, they participate in a card sorting activity classifying relations as functions or not.
Columbus City Schools
Totally Tides
Surf's up, big kahunas! How do surfers know when the big waves will appear? They use science! Over the course of five days, dive in to the inner workings of tidal waves and learn to predict sea levels with the moon as your guide.
Curated OER
How Far Did They Go?
Students create a map. For this direction and distance lesson, students come up with familiar places in the community and calculate the distances from these places to the school. Students create a map that displays these places and their...
Curated OER
Lobster Business Charts
Young scholars research four Maine based businesses involved with lobster fishery as a career analysis. For this career exploration lesson, students research lobster fishery businesses and write a class book showing the progression of a...
Curated OER
A World of Information
Students analyze data and statistics about countries around the world. They read graphs and charts, color a world map to illustrate the top ten statistics about the world, and write a paragraph to summarize their information.
Curated OER
Informational Text Features
How can you tell if the text you're reading is informational or narrative? Show your reading class this basic PowerPoint to illustrate the characteristics of an informational text. What makes this presentation especially effective is...
Curated OER
Arkansas is Our State: Differentiating Between a State and a Country
An ambitious geography lesson is geared toward kindergartners. They discover what the differences are between states and countries. They look at maps of Arkansas, and learn what the shapes and lines mean. Additionally, they create a...
Curated OER
Air Pollution in Mexico City
A fantastic lesson on urban air pollution problems throughout the world is here for you. Learners understand that there are many factors involved in creating pollution, that there are many health effects brought on by air pollution, and...
Moanalua Gardens Foundation
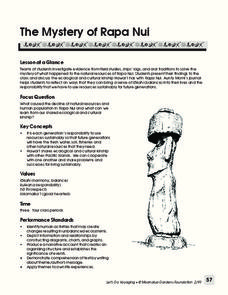
The Mystery of Rapa Nui
What caused the collapse of the environment on Rapa Nui (Easter Island)? Who constructed the Moai? What was their purpose? Class members assume the role of investigators and use evidence drawn from field studies, ships' logs, and...
National Museum of Nuclear Science & History
Alphas, Betas and Gammas Oh, My!
Referring to the periodic table of elements, nuclear physics learners determine the resulting elements of alpha and beta decay. Answers are given in atomic notation, showing the atomic symbol, mass, atomic number, and emission particles....
Curated OER
Exploring an Atlas
Students explore global geography by participating in an atlas activity. In this countries of the world lesson plan, students collaborate in small groups and analyze an atlas while researching continents, countries and demographics....
Curated OER
Where is the Trail? The Journey of Lewis and Clark
Students explore the trail followed by Lewis and Clark on their journey across the United States. In this United States History lesson, students complete several activities to establish the Lewis and Clark Expedition, including a class...
Curated OER
Hopes and Dreams: A Spreadsheet Lesson Using Excel
Fourth graders read "The Far Away Drawer" by Harriet Diller and discuss the story as a class. After discussion, 4th graders create a t-shirt GLYPH about their hopes and dreams,share their information with the class and create spreadsheets.
Other popular searches
- Maps Graphs and Charts
- Charts, Graphs, Maps
- Maps, Charts, Graphs, Tables
- Charts, Maps, Graphs
- Charts, Maps and Graphs


