College Board
Evaluating Sources: How Credible Are They?
How can learners evaluate research sources for authority, accuracy, and credibility? By completing readings, discussions, and graphic organizers, scholars learn how to properly evaluate sources to find credible information. Additionally,...
OpenStax
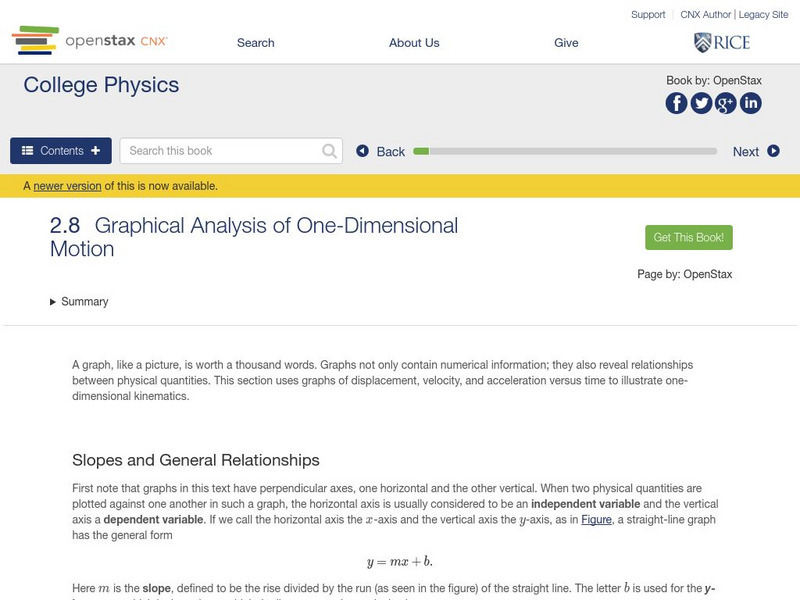
Open Stax: Graphical Analysis of One Dimensional Motion
In the following interactive module students will describe a straight-line graph in terms of its slope and y-intercept. They will determine average velocity or instantaneous velocity from a graph of position vs. time.
Cuemath
Cuemath: Discrete Data
A comprehensive guide for learning all about discrete data with definitions, the difference between discrete and continuous data, graphical representation of discrete data through visualization, solved examples, and interactive questions...
Georgia Department of Education
Ga Virtual Learning: Poetry Analysis Tp Castt [Pdf]
This two-page PDF includes a Poetry Analysis format using the acronym TP--CASTT. It explains how to evaluate a poem. It is followed by the blank form for students to use when analyzing a poetry.
Texas Education Agency
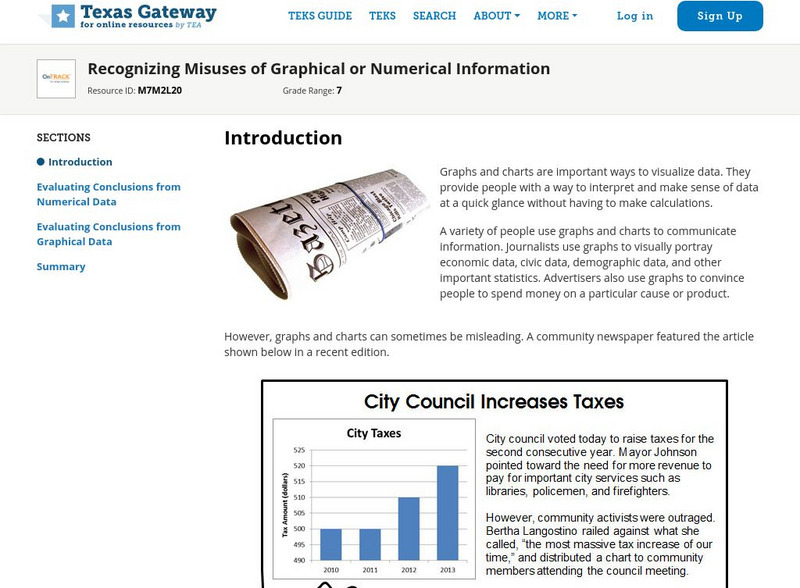
Texas Gateway: Recognizing Misuses of Graphical or Numerical Information
Given a problem situation, the student will analyze data presented in graphical or tabular form by evaluating the predictions and conclusions based on the information given.
PBS
Pbs Learning Media: Finch Beak Data Sheet [Pdf]
This graphic from Ecology and Evolution of Darwin's Finches by Peter Grant presents data from the Galapagos Islands, showing that a severe drought put selective pressure on the population of Darwin's finches and resulted in a change in...
CK-12 Foundation
Ck 12: Types of Data Representation: Graphic Displays of Data
[Free Registration/Login may be required to access all resource tools.] Here you will explore displays of data using bar charts, histograms, pie charts and boxplots, and learn about the differences and similarities between them and how...
Better Lesson
Better Lesson: Plotting Climate Data
Third graders use climate data to create a key, plot data points, and interpolate data.
CK-12 Foundation
Ck 12: Graphic Displays of Data
[Free Registration/Login may be required to access all resource tools.] In this lesson, students compare different types of graphic displays to understand how to choose the best method of displaying their data, and they learn the...
Florida Center for Reading Research
Florida Center for Reading Research: Text Analysis: Compare and Contrast [Pdf]
A lesson plan in which students use graphic organizers to compare and contrast topics within a text. Materials are included.
Other
Bscs: Frog Eat Frog World
In this self-directed lesson, students will use maps and Frogwatch data to explore the natural and invasive range of the American bullfrog. A handout with everything the student needs to complete this lesson is available as a PDF or...
Science Buddies
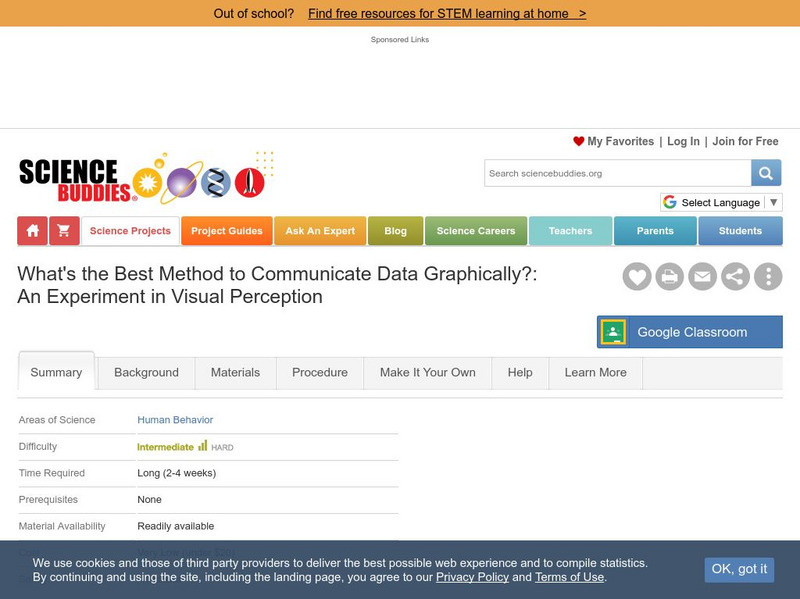
Science Buddies: An Experiment in Visual Perception
Graphical methods of data presentation are a key feature of scientific communication. This project will get you thinking about how to find the best way to communicate scientific information.
Other
Reading Quest: Making Sense of Social Studies
Teaching students to read well in areas other than language arts requires teaching and reinforcing the kinds of reading strategies taught here. There are 27 strategies, ranging from brainstorming to word mapping. The site includes PDF...
National Geographic
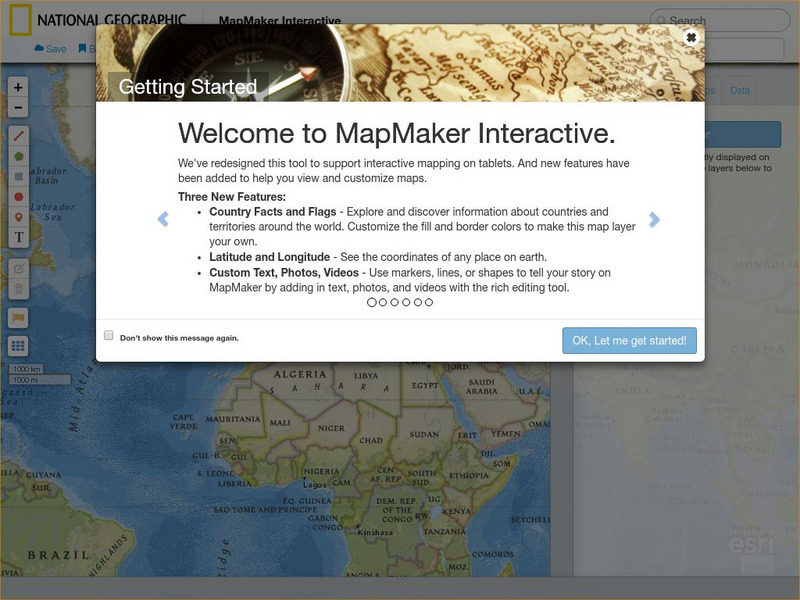
National Geographic: Mapmaker Interactive
Interactive map maker in which students can manipulate world maps adding layers and data with multiple sources of information.
Annenberg Foundation
Annenberg Learner: Drawing a Box Plot
Learn how to represent the Five-Number Summary graphically using a box plot.
Better Lesson
Better Lesson: Collaborative Booktalk: Sharing and Writing Development
Are dark themes in young adult novels harmful or helpful to teens? Students will explore this question and will create an argumentative writing piece based on textual evidence. Videos of the lesson in action, examples of student work,...
Texas Education Agency
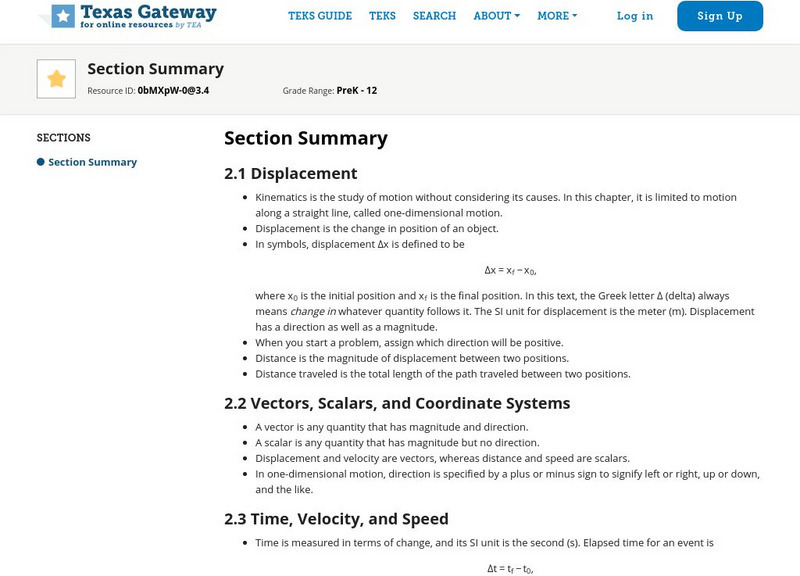
Texas Gateway: Kinematics Section Summary
This is a summary of the main topics for AP Physics Chapter 2 Kinematics. These include Displacement; Vectors, Scalars, and Coordinate Systems; Time, Velocity, and Speed; Acceleration; Motion Equations for Constant Acceleration in One...
Department of Defense
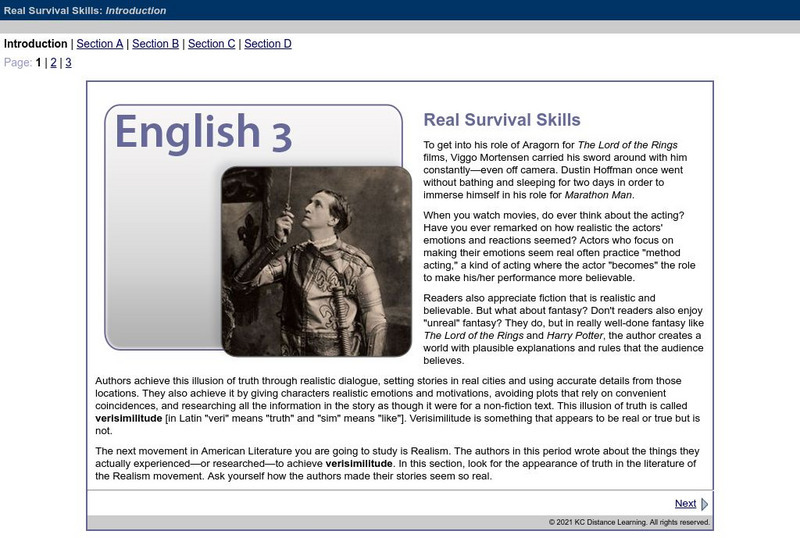
Do Dea: Real Survival Skills
Learn about process analysis, writing procedurals texts, the steps of the writing process, and cause and effect in this unit. Also, examine patterns of organization in writing. A handy chart shows common organizational patterns which...
CK-12 Foundation
Ck 12: Scalar Projections
[Free Registration/Login may be required to access all resource tools.] Represent scalar multiplication graphically by scaling vectors and possibly reversing their direction; perform scalar multiplication component-wise.
Texas Instruments
Texas Instruments: Identifying Types of Correlation From a Graph and Calculator
Students will identify different types of correlations graphically and by using the linear regression analysis obtained from a TI-84 Plus calculator. Students will also obtain and know the significance of a correlation coefficient as a...
CK-12 Foundation
Ck 12: Statistics: Applications of Histograms
[Free Registration/Login may be required to access all resource tools.] Use calculators to create graphical representations of data, such as histograms.
Science Education Resource Center at Carleton College
Serc: Computers in Chemistry at Cabrillo College
The Computers in Chemistry at Cabrillo College project creates visually compelling and effective educational chemistry software for both students and instructors. Includes molecular models, student exercises, tutorials, and posters that...



![Pbs Learning Media: Finch Beak Data Sheet [Pdf] Website Pbs Learning Media: Finch Beak Data Sheet [Pdf] Website](https://content.lessonplanet.com/knovation/original/38853-54307de55e3ff0df41d67fbc6e061b4b.jpg?1661365772)


![Florida Center for Reading Research: Text Analysis: Compare and Contrast [Pdf] Lesson Plan Florida Center for Reading Research: Text Analysis: Compare and Contrast [Pdf] Lesson Plan](https://content.lessonplanet.com/knovation/original/509102-e19a3df2f7653b311f3d50461f4c3bc7.jpg?1661786971)
