Curated OER
Estimation and Pattern Discovery
Students collect sunflower heads from their community garden. They estimate its seed count using different strategies. They graph their estimations on a graph and use calculators to find the actual total.
EngageNY
Nonlinear Models in a Data Context
How well does your garden grow? Model the growth of dahlias with nonlinear functions. In the activity, scholars build on their understanding of mathematical models with nonlinear models. They look at dahlias growing in compost and...
Curated OER
Connecting Algebraic Reasoning to Models
Young scholars analyze relating a model to an algebraic equation and visa versa. Patterns are reviewed in detail and then in pairs new models are created and then translated into a word problem or equation. They illustrate their models...
Curated OER
Be Sharp and Never Flat
An outstanding lesson on music awaits your young composers! They learn about patterns found in music, the different sections of an orchestra, and see the differences between musicians and a composer. Excellent streamed videos and good...
Curated OER
I'm a Weather Watcher Watching plants grow by......my,my,my
Students investigate how weather affects how plants grow. They collect data on weather and plant growth for a week and display the data on a graph. For a culminating experience they design a movie using software that shows plant growth...
Curated OER
Getting A Grip On Graphs
Fourth graders gather variety of data and create a graphs to display the data.
Curated OER
Growing and Graphing
Students visit a 2nd and a 4th grade class to measure the heights of older students using large building blocks as a non-standard unit of measure. They can also measure adults in the school community. Results are displayed in...
Curated OER
Getting A Grip On Graphs
Fourth graders investigate the concept of graphing and comparing different types of data using pictographs, line graphs, scatter plots, etc... They gather data and make interpretations while examining the medium of how it is displayed.
Curated OER
Discovering Growth Patterns
In this statistics worksheet, students examine data on a variety of subjects related to growth patterns and apply the data to 4 different graphs.
Virginia Department of Education
Mathematics Vocabulary Cards - Grade 2
Augment your math curriculum with posters detailing several concepts important to second grade math. Each poster features one math term from geometry, measurement, probability and statistics, computation and estimation, numbers and...
Mathematics Vision Project
Module 1: Sequences
Sequences are all about recognizing patterns. A module of 11 lessons builds pupils' understanding of sequences through pattern analysis. The practice connects the analysis to linear and exponential equations. This is the first module in...
EngageNY
Linear and Exponential Models—Comparing Growth Rates
Does a linear or exponential model fit the data better? Guide your class through an exploration to answer this question. Pupils create an exponential and linear model for a data set and draw conclusions, based on predictions and the...
Virginia Department of Education
A-Mazing Plants
Have your young scientists questioned why plants grow a particular way? Through this learning opportunity, scientists gain firsthand knowledge about how plants develop and various factors that affect rates of growth as they bring plants...
Virginia Department of Education
Weather Patterns and Seasonal Changes
Get your class outside to observe their surroundings with a lesson plan highlighting weather patterns and seasonal changes. First, learners take a weather walk to survey how the weather affects animals, people, plants, and trees during...
Oklahoma State University
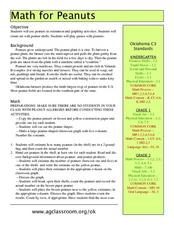
Math for Peanuts
Peanuts! Get your peanuts! Kids explore math, art, and agriculture concepts focused on peanuts. There is a brief informational text to get them started, and you'll find definitions of five in-text vocabulary words to address. Kids...
Illustrative Mathematics
The Djinni’s Offer
The djinni in this resource offers gold coins. Learners use the properties of exponents to make their decision as one offer increases exponentially. This makes a great group project. As the commentary suggests, start by having groups...
Curated OER
Dream! (Part One)
Young scholars share with the class what they want to be when they grow up. As a class, they identify what they want to be for Halloween as well. They are videotaped stating their dream and photographed with their mask. Using the masks,...
Curated OER
Spring Potted Plants
Pupils identify and interpret plant growth as well as gain graphing skills and other important knowledge related to potting plants. They take a regular milk jug and cut off the top, leaving the handle and the rest intact. Then, students...
Curated OER
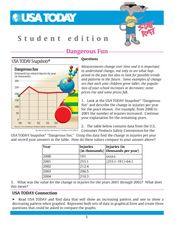
Dangerous Fun
In this line graph worksheet, students analyze the data on a graph about toy-related injuries by year. Students solve 5 problems in which the change in injuries per year is calculated and recorded on a table.
Curated OER
Virtual Field Trip / Route, Mileage and Gasoline Cost Graphs
Students use a spreadsheet program to graph and compare milage, gasoline costs and travel time for two travel routes in their virtual field trip in Michigan. They determine the most economical route based on the graphs and calculations.
Curated OER
Investigation - Looking For Triangles
Seventh graders investigate a series of triangles, looking for patterns and generalizing what they have found. They analyze the pattern data and organize it into a table and graph. Students identify the relationship and discover the rule...
Curated OER
Virtual Field Trip
This hands-on resource has future trip planners analyze graphs of mileage, gasoline costs, and travel time on different routes. While this was originally designed for a problem-solving exercise using a Michigan map, it could be used as a...
Curated OER
Growing Rock Candy
Students observe the growth of rock candy. In this crystal growth activity, students make rock candy and measure the crystal growth over five days.
Curated OER
Growing Circles
High schoolers identify the equation to represent a circle. In this algebra lesson, students review properties of conics and how they are related. they use a robot to create a visual of circles and their application to the real world.


