Inside Mathematics
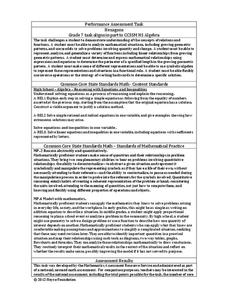
Hexagons
Scholars find a pattern from a geometric sequence and write the formula for extending it. The worksheet includes a table to complete plus four analysis questions. It concludes with instructional implications for the teacher.
California Education Partners
Science Fair Project
Plant the data firmly on the graph. Given information about the growth rate of plants, pupils determine the heights at specific times and graph the data. Using the information, scholars determine whether a statement is true and support...
Virginia Department of Education
Relationships Round Robin
Mathematics is all about patterns. Young mathematicians analyze geometric patterns to write algebraic expressions. They use the expressions to predict future stages of the patterns.
Inside Mathematics
Conference Tables
Pupils analyze a pattern of conference tables to determine the number of tables needed and the number of people that can be seated for a given size. Individuals develop general formulas for the two growing number patterns and use them to...
Curated OER
Garden Patterns
In this math learning exercise, students find the values of the amount of plants that are growing in the garden based upon the dialogue.
Public Schools of North Carolina
Math Stars: A Problem-Solving Newsletter Grade 2
Develop the problem solving skills of your young learners with this collection of math newsletters. Covering a variety of topics ranging from simple arithmetic and number sense to symmetry and graphing, these worksheets offer a nice...
Curated OER
Discovering Growth Patterns
In this statistics worksheet, students examine data on a variety of subjects related to growth patterns and apply the data to 4 different graphs.
Illustrative Mathematics
The Djinni’s Offer
The djinni in this resource offers gold coins. Learners use the properties of exponents to make their decision as one offer increases exponentially. This makes a great group project. As the commentary suggests, start by having groups...
Curated OER
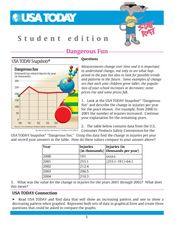
Dangerous Fun
In this line graph worksheet, students analyze the data on a graph about toy-related injuries by year. Students solve 5 problems in which the change in injuries per year is calculated and recorded on a table.
Curated OER
Population Biology
In this population activity, students will compare two population growth graphs and complete four short answer questions. Then students will investigate the factors that influence population growth in 8 fill in the blank statements and 4...
Curated OER
Rainforest Data
In this geography learning exercise, students use the climate data given to create a temperature line graph and rainfall bar graph for each of three locations given. Then they use an atlas to compare their graphs and draw conclusions...
Curated OER
Algebraic Relationships
Here are 17 various forms of problems that range from matching equivalent expressions to word problems. Included are problems for substutiing values into expressions and using the order of operations, simplifying algebraic expressions,...
Curated OER
Cocoa Around the World
In this geography activity, students answer 4 multiple choice questions regarding cocoa production around the world using the map and information boxes.


