Curated OER
Collecting the Rays
Students investigate the affect shape has on the ability of a solar panel to collect sunlight. In this collecting sunlight using a solar panel lesson, students determine which solar panel shape collects the most sunlight. Students use...
Curated OER
Will Exams Be Cancelled?
If the flu outbreak continues, exams will have to be canceled. Investigate the properties of exponential and logarithmic functions. In this algebra lesson, young scholars use the TI to examine and differentiate between exponential growth...
Curated OER
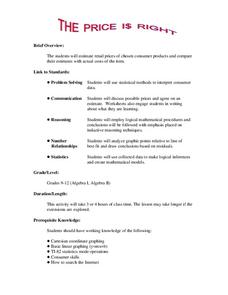
The Price Is Right
Young scholars create a list of products with estimated prices. In this algebra lesson, students learn to write equations using variables. They match their created list with that of actual products and compare their prices,
Curated OER
Writing a Function Rule
In this Algebra I/Algebra II worksheet, students determine the equation that correctly represents the relationship between the x and y values provided. The one page worksheet contains four multiple choice problems. Answers are not...
Curated OER
La Toteca- A Tropical Paradise
Young scholars collect data on the time of the ferry. In this algebra lesson, students use the data to predict a ferry schedule. They also compute the depth where oxygen would be needed when diving.
Curated OER
Gummy vs. Gum
Students explore numbers patterns and write equations to describe the pattern. They apply the equations to further the patterns.
Curated OER
Tilted Squares and Right Triangles
Students investigate squares. They generate patterns from structured situations and find a rule for the general term and express it using words and symbols. Students generate patterns from a rule and substitute values and formulas.
Curated OER
Comparison of Two Different Gender Sports Teams - Part 1 of 3 Measures of Central Tendency
Students gather and analyze data from sports teams. In this measures of central tendency lesson, students gather information from websites about sports team performance. Students analyze and draw conclusions from this data. This lesson...
Curated OER
Modeling With Circular Functions
Students explore circular functions. They identify the amplitude, period, phase shift and vertical shift of circular functions. Students analyze phenomena described by sine waves and they find mathematical models for transforming images...
Curated OER
Looking For Triangles
Learners solve problems with triangles. In this geometry instructional activity, students analyze shapes to find different triangles. They name the shapes created by putting triangles together.
Curated OER
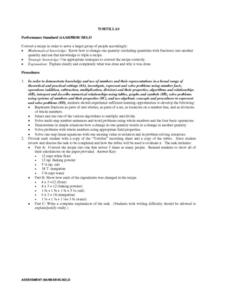
Tortillas
Students convert recipes for tortillas. They calculate the amounts of ingredients as they convert recipes and write an explanation of the task to demonstrate their calculations. After reviewing their calculations, they demonstrate how...
Curated OER
Square Milk Bottle Crates
Learners attempt a problem that Students has the potential to have more than one solution. Hence the problem is accessible to a wide range of learners. The problem is essentially about finding patterns and this is typical of a number of...
Curated OER
Perimeters, Patterns, and Conjectures
Students discover patterns and write conjectures relating to perimeters and polygons. Working in cooperative learning groups, they use manipulatives and graphic organizers to solve problems then answer a series of questions in which they...
Curated OER
Flow Rates of Faucets and Rivers
Students work together to discover the flow rates of faucets and rivers. They relate their results to engineering and applied science concepts. They make predictions on the flow rate of a nearby river in their local community.
Curated OER
Can Stack
Learners are able to find the rule for summing consecutive numbers;
identify the pattern of triangular numbers. They then solve the given problem using logic and mathematical reasoning.
Curated OER
Rows of Numbers
Students generate patterns from a structured situation, find a rule for the general term, and express it in words and symbols. They also devise and use problem solving strategies in a systematic way.
Curated OER
Poppy Meets Pythagoras
Eighth graders find connections between numbers in a table; use Pythagoras' theorem in a general algebraic form; and measure accurately from a scale drawing to find a method that might enable the helicopter to land inside a rectangular...
Curated OER
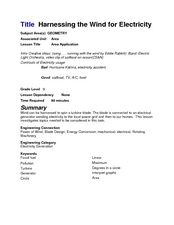
Harnessing the Wind for Electricity
Ninth graders explain how wind can produce electricity. In this geometry lesson, 9th graders construct their own pin wheel turbine and calculate its power. They discuss the pros and cons of using wind generator.
University of Colorado
University of Colorado: Ph Et Interactive Simulations: Graphing Lines
Explore the world of lines. Investigate the relationships between linear equations, slope, and graphs of lines.
University of Waterloo (Canada)
Univ. Of Waterloo: Wired Math: Linear Graphing: Graphing and Analyzing [Pdf]
The mathematics resource assesses students on linear relations. The activity has problems with graphing and analyzing linear relations. Some of the topics included are variation, scatter plots and linear relationships. The worksheet has...
Other
Linear Functions, Slope and Regressions
Find activities here for linear functions, slopes and regression lines. Use them for classroom work or individual assignments.
Khan Academy
Khan: Lsn 8: Interpreting Relationships in Scatterplots/graphs/tables/equations
This lesson focuses on Interpreting and analyzing linear, quadratic, and exponential models and graphs. Students will use best fit lines to interpret contexts, distinguish whether contexts are linear or exponential functions, use the...
Khan Academy
Khan Academy: Linear Equations Word Problems: Graphs
Solve word problems about real-world relationships that are given in graphs. Students receive immediate feedback and have the opportunity to try questions repeatedly, watch a video or receive hints.
TeachEngineering
Teach Engineering: Linear Regression of Bmd Scanners
Students complete an exercise showing logarithmic relationships and examine how to find the linear regression of data that does not seem linear upon initial examination. They relate number of BMD scanners to time.










![Univ. Of Waterloo: Wired Math: Linear Graphing: Graphing and Analyzing [Pdf] Unknown Type Univ. Of Waterloo: Wired Math: Linear Graphing: Graphing and Analyzing [Pdf] Unknown Type](https://d15y2dacu3jp90.cloudfront.net/images/attachment_defaults/resource/large/FPO-knovation.png)


