Curated OER
What's the Problem?
Fourth graders redefine the problem of Where's the Heart of Florida? and begin to formulate possible solutions using graphic organizers.
Curated OER
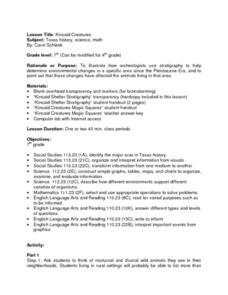
Kincaid Shelter Stratigraphy
Seventh graders illustrate how archeologists use stratigraphy to help determine environmental changes in a specific area since the Pleistocene Era, and to point out that these changes have affected the animals living in that area.
Curated OER
This is Your Life!
Pupils create an autobiographical timeline that be shared with a classmate. They write a one paragraph biography based on the timeline.
Curated OER
Lesson 2: Maine's Merchant Marines
Students simulate the quarters aboard a ship. They write a letter to Joanna Colcord or Alice Drinkwater that shows an understanding of the experience of being aboard ship, and asks further historical questions about the experience.
Curated OER
Japan: A Cultural Study
Third graders "take a trip" to Japan. They discover what life is like for a typical Japanese child and compare/contrast it to life in America. They give an oral presentation of Japanese holidays and festivals.
Curated OER
Brother Against Brother
Eighth graders read Across Five Aprils and correlate it to a unit on the Civil War. They culminate the unit by writing a a piece of historical fiction in the first person entitled "Brother Against Brother."
Curated OER
Aruba Cloud Cover Measured by Satellite
Students analyze cloud cover over Aruba. They compose and submit written conclusions which include data, analysis, errors in data collection, and references.
Curated OER
Kincaid Creatures
Students brainstorm a list of nocturnal and diurnal wild animals they see in their community and discuss how the animals would be different if they were living during the Ice Age. Using a handout, they discover how archeologists record...
Curated OER
The Constitution
Students use both electronic and traditional resources to research information about U.S. Constitution, answer questions pertaining to Congress and the Presidency, and design HyperStudio presentation to display answers to research...
Curated OER
Cultural Corner- "Mexico"
Young scholars use print and electronic resources to gather information about Mexico. They present a mini-museum to share with students, parents, and other interested classes around the district. They present their information in a video...
Curated OER
The Sound of Calm
Students examine the relationships that exist between ocean currents, wind and climate. Using those relationships, they discuss how they affect the oceans. They create their own music to represent the sounds of the ocean and share them...
Curated OER
Watershed Management
Students investigate the concept of a watershed. They conduct research into the concept using a variety of resources. Students take a field trip to a local watershed to make observations. The outcome is a report concerning the outside...
Curated OER
Owning a Pet
Fourth graders identify and use different forms of writing for various purposes. Using the internet, they read and gather information and write quesitons for their own investigations on the various pets they could own. They practice...
Curated OER
Using Oral History to Understand Immigrant History
Learners use oral history to comprehend how life chaned for men, women, and childern when they immigrated to the United States. Students conduct interviews with immigrants in an attempt to interpret hardships, lifestyles, careers, and...
Curated OER
Work And Resistance In America
Students investigate the history and events that surround the industrial revolution. They conduct research using secondary sources. They look reflectively at the history in order to build an idea of how the arts could have influenced the...
Curated OER
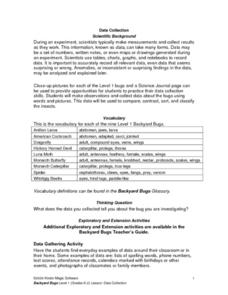
Science: Backyard Bugs Data Collection
Students practice data collection skills by observing common bugs found in their local environment. Once the data is collected they complete data sheets to compare, contrast, sort, and classify the insects. The lesson includes...
Curated OER
Quarter Coin Cookies
Young scholars study the historical figures and symbols of U.S.
patriotism depicted on the penny, nickel, dime, and quarter coins. They explore the processes involved in making coins, and how metals canchange in consistency from the...
Curated OER
What Does a Quarter Weigh?
Learners study the historical figures and symbols of U.S.
patriotism depicted on the penny, nickel, dime, and quarter coins. They
create a balance scale from common materials to measure the approximate weight
of a quarter.
Curated OER
What are Quarters Made of?
Learners study the meaning, symbolism, and value of U.S. coins,
especially the quarter. They l research why in 1965 the U.S. Mint decided to
change the metal composition of the quarter to copper coated with zinc. In addition, they...
City University of New York
Virtual Geology: Maps Home Page: Topic and Quiz Menus
This collection of resources cover map topics and includes quizzes for improving map and globe usage skills.
Other
La Rue Literacy Exercises: Reading a Map: Quiz 12
In this quiz, students are given sections of a map with locations like the school, post office, back, etc. They are asked questions about directions from one place to the other.
Other
Honolulu Hi 5: Cool Maps With Awesome Weather Data Across 1,219 Us Cities
Explore the weather in states and cities across the United States. Two maps with accompanying graphs are provided. The first indicates the number of comfortably warm summer days a place has and the second shows the temperature and how...
E-learning for Kids
E Learning for Kids: Math: Elephant Plant: Data and Graphs
On this interactive website students practice various math skills using a real-life scenario involving plants. Those skills include interpreting data in a circle graph, interpreting data in a divided bar graph, and interpreting a bar...
E-learning for Kids
E Learning for Kids: Math: Group of Pyramids: Fractions and Graphs
On this interactive website, students practice various math skills using a real-life scenario at the pyramids. Those skills include showing percentages as fractions and decimals and interpreting data in a sector graph.
Other popular searches
- Maps Graphs and Charts
- Charts, Graphs, Maps
- Maps, Charts, Graphs, Tables
- Charts, Maps, Graphs
- Charts, Maps and Graphs


