Curated OER
Graphs and Ellipses
Students explore linear graphs, the parabola and the rectangular hyperbola.
Curated OER
Life Expectancy at Birth
Students create a line graph on the life expectancy for males and females in Canada. In this math and health lesson plan, students review table and graph terminology, create line graphs, and analyze the differences in life expectancy...
Curated OER
Show Me!
Students analyze and interpret graphs. In this graphing lesson, students view a video and construct their own graphs (line, circle, bar) from given sets of data.
Curated OER
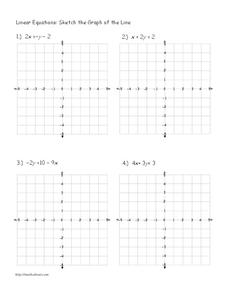
Linear Equations: sketch the graph of the line
In this linear equations worksheet, students sketch the graph of the lines given to them. Students draw the lines of 4 linear equations on 4 graphs.
Curated OER
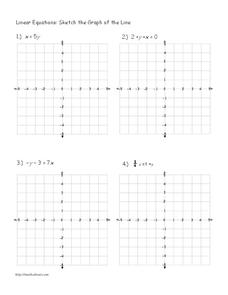
Linear Equations: Sketch the graph of the line
In this linear equations worksheet, students sketch the line on the graph of the equation given to them. Students sketch 4 lines on graphs.
Curated OER
Linear Equations: Sketch the Graph of the Line
In this linear equations worksheet, 6th graders complete 4 problems, sketching the graphs of lines of equations. A reference web site is given for additional activities.
Curated OER
Savings Planning Using Tables, Line Graphs and Early Proportionality
Students use proportional reasoning to make a chart of daily savings transactions and balances. In this accounting lesson, students read word problems and complete three handouts about a bidding and accounting problem. Students finish...
Curated OER
Race Track (Culminating Activity)
Students graph and solve linear equations. In this algebra lesson, students use the slope and y-intercept to graph lines. They relate lines to the real world using different applications.
Curated OER
Independent Practice 2: Graphing Lines by Graphing Two Points
In this graphing lines worksheet, learners solve linear equations and then graph the points on the line. This one-page worksheet contains six problems with a coordinate plane provided for each one.
CCSS Math Activities
Smarter Balanced Sample Items: 8th Grade Math – Target C
Target C from the Smarter Balanced assessment for eighth grade is understanding the connections between proportional relationships, lines, and linear equations. A slide show includes items about graphing proportional relationships and...
CK-12 Foundation
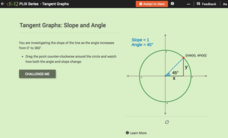
Tangent Graphs: Slope and Angle
Learning about tangents doesn't have to be a slippery slope. Pupils drag a point around a unit circle to see how angle affects the slope of a line. They individually answer a set of challenge questions to come to the conclusion that...
Curated OER
Decisions, Decisions, Decisions
Students examine graphs to find the most appropriate for various kinds of data. In this graphing instructional activity, student create bar, line and circle graphs. Students create graphs electronically and manually interpreting the data.
Curated OER
Slope of Line
In this algebra worksheet, students calculate the slope of a line. They graph a linear equation given the slope and y-intercept and identify the slope and y-intercept given a linear graph. There are 15 questions.
Curated OER
Excel temperature Graphs
Students gather data about the weather in Nome, Alaska. In this Nome Temperature lesson, students create an excel graph to explore the weather trends in Nome. Students will find the average weather and add a trend line to their graph.
Curated OER
Lines of Fit
Students analyze graphs. In this algebra lesson, students find the line of best fit, using scatter plots. They calculate the sale of popcorn as it relates to the price. They then analyze the graphs for positive, negative and no correlation.
Curated OER
An "Average" Golf Score
Ninth graders investigate mean, median, and mode. In this mean, median, and mode lesson, 9th graders research gold data for the top ten scores in two golf tournaments. Students make tables and graphs of the data. Students determine...
Curated OER
Lines of Fit
Students graph an equation and analyze the data. In this algebra lesson, students graph scatter plots and identify the line of best fit using positive correlation, negative correlation an d no correlation. They apply their data analysis...
Curated OER
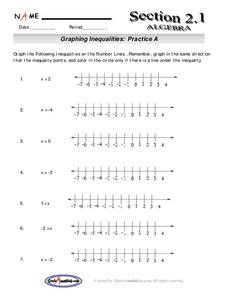
Graphing Inequalitites
Ninth graders graph inequalities. In this algebra lesson, 9th graders graph equations on a number line using inequalities and plain numbers. They solve inequalities with negative numbers also.
Curated OER
Graphing Lines
In this algebra worksheet, 9th graders are given a linear equation and asked to graph the lines. There are 12 questions with an answer key.
Curated OER
Unit 8 - Statistical Diagrams
For this statistical diagrams worksheet, high schoolers solve 30 short answer problems. Students find the mean of a set of numbers and read/interpret a graph to answer questions. High schoolers determine the x-values that satisfy a...
Curated OER
Frequency Tables; Discrete Ungrouped Data
For this frequency tables worksheet, students utilize given data to work out three frequency charts with one containing values and a pie chart involving angles for each value. Students complete three vertical line diagrams and check all...
Curated OER
Lines of Fit
Students graph an equation and analyze the data. In this algebra lesson plan, students graph scatter plots and identify the line of best fit using positive correlation, negative correlation an d no correlation. They apply their data...
Curated OER
Functions & Algebra
Students examine linear equations. In this functions and algebra lesson, students write equations in the slope-intercept form. They enter data in a graphing calculator, examine tables, and write linear equations to match the data.
Curated OER
Parabolas
Students investigate parabolas and their equations. In this parabolas and their equations lesson, students graph quadratic equations on their graphing calculator. Students find the axis of symmetry of a parabola. Students discuss the...
Other popular searches
- Line Graphs
- Double Line Graphs
- Bar and Line Graphs
- Line Pie Bar Graph
- Interpreting Line Graphs
- Line Plot Graphs
- Making Line Graphs
- Reading Line Graphs
- Analyzing Line Graphs
- Creating Line Graphs
- Number Line Graphs
- Reading Double Line Graphs


