Curated OER
Graphs and Functions
Use this series of activities to introduce learners to graphing functions. They graph both linear and quadratic equations by hand and with a Graph Sketcher Tool. Several imbedded links and handouts are included in the lesson.
Curated OER
Other Equations of Lines
For this algebra worksheet, students find equations for 4 lines when given their slope and one point on the line. They write two linear equations when given two points on a line. Students analyze the equations of 3 sets of linear...
Curated OER
Gradients of Parallel Line Segments
In this gradient worksheet, students draw line segments and determine if they are parallel. They plot points on a coordinate plane and calculate the gradient of each created line. This five-page worksheet contains 8 multi-step problems....
Curated OER
Graphing Inequalities
In this graphing inequalities worksheet, students solve and graph 10 different problems that include various inequalities. First, they study each of the examples given. Then, students graph the remaining equalities and inequalities as...
Curated OER
Graphing Using Cookies
Students differentiate between bar graphs, line graphs, pictographs and bar graphs. After participating in a hands-on cookie activity, students label and draw their own graphs.
Curated OER
Graphing in the Information Age
Students create a variety of graphs based on population data. In this statistics instructional activity, students use data that can be gathered on-line to make a bar chart, line graph, and circle graph.
Curated OER
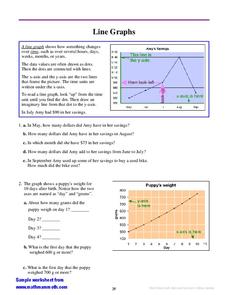
Line Graphs
In this interpreting line graphs worksheet, students read an explanation and observe an example of a line graph and its parts and then answer questions interpreting two line graphs. Students write eleven answers.
Curated OER
Study Buddies: Reading Line Graphs
In this math worksheet, students will work with a coach to solve a problem by reading a line graph. Students will follow a step-by-step process and notes are provided for the coach.
Curated OER
Making Predictions from Data with a Graphing Calculator
In this making predictions from data activity, students solve 15 short answer problems. Students determine average miles per gallon given data on miles traveled and gas used. Students make predictions using the data and a line of best fit.
Curated OER
Graphing of Speed vs. Time
In this acceleration worksheet, students use the date given to create 2 different speed vs. time graphs. Then students use the graphs to complete 15 short answer questions.
Curated OER
Analyzing Equations Through Slope and Y-int
With problems applying to modern-day topics like Netflix and McDonald's, math whizzes analyze graphs and investigate the slopes. In this algebra worksheet, learners identify the slope and y-intercept of the given equations. They graph...
Noyce Foundation
Granny’s Balloon Trip
Take flight with a fun activity focused on graphing data on a coordinate plane. As learners study the data for Granny's hot-air balloon trip, including the time of day and the distance of the balloon from the ground, they practice...
Virginia Department of Education
Solving and Graphing Inequalities
You can't go wrong with a lesson plan that involves candy! Learners solve and graph one-variable inequalities and use candy to graph the solution. Individuals associate open circle graphs with life savers and closed circle graphs with...
Curated OER
Slope-Intercept Form of a Line
Using the subscriber website Explorelearning.com, young mathematicians observe changes in the slope and y-intercept and their effect on the graph of lines. This activity helps students develop an intuitive sense of the connection between...
Beyond Benign
Municipal Waste Generation
Statistically, waste may become a problem in the future if people do not take action. Using their knowledge of statistics and data representation, pupils take a look at the idea of waste generation. The four-part unit has class members...
West Contra Costa Unified School District
Discovering Slope of a Line in Standard Form
From start to finish this skills practice resource provides a way for individuals to explore the standard form equation of a line. Begin with a warm-up, work through the problems, and then discover the relationship between the equation...
Curated OER
Drive the Data Derby
Three days of race car design and driving through the classroom while guessing probability could be a third graders dream. Learn to record car speed, distances traveled, and statistics by using calculation ranges using the mean, median,...
EngageNY
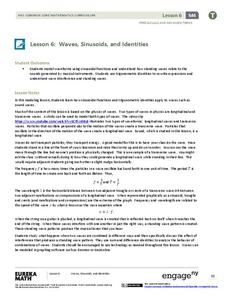
Waves, Sinusoids, and Identities
What is the net effect when two waves interfere with each other? The lesson plan answers this question by helping the class visualize waves through graphing. Pupils graph individual waves and determine the effect of the interference...
Curated OER
Coordinate Plane and Number Line
In this graph and number line worksheet, students answer multiple choice questions about points on a graph and points on a number line. Students answer 10 questions.
Curated OER
The Power of Graphical Display: How to Use Graphs to Justify a Position, Prove a Point, or Mislead the Viewer
Analyze different types of graphs with learners. They conduct a survey and determine the mean, median and mode. They then identify different techniques for collecting data.
PBS
Button, Button
Youngsters count, classify, and estimate quantities using buttons after a read aloud of The Button Box by Margarette S. Reid. They discuss the difference between guessing and estimating. Based on an experiment, they predict the number of...
Curated OER
Range, Mode, and Median
Fifth and sixth graders sort data from least to greatest and mark an X on the line plot to show how many of each number. Then they determine the range, mode, and median for the problem.
Curated OER
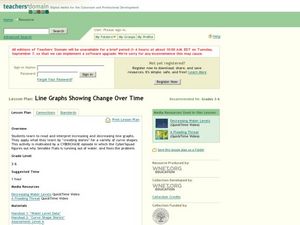
Line Graphs Showing Change Over Time
Students analyze line graphs. In this graphing lesson, students analyze line graphs paying attention to how the data changes over time. This lesson includes two video clips, one demonstrating an increasing line graph and one...
Curated OER
Math Lesson: What Do You Want to Know? - Country Statistics
Students are able to identify the characteristics of a variety of graphs (i.e. bar graph, line graph, pie graph, scatter plot, population pyramids, etc.) They recognize how the type of data to be presented plays a role in choosing the...
Other popular searches
- Line Graphs
- Double Line Graphs
- Bar and Line Graphs
- Line Pie Bar Graph
- Interpreting Line Graphs
- Line Plot Graphs
- Making Line Graphs
- Reading Line Graphs
- Analyzing Line Graphs
- Creating Line Graphs
- Number Line Graphs
- Reading Double Line Graphs


