Curated OER
Linear Equations
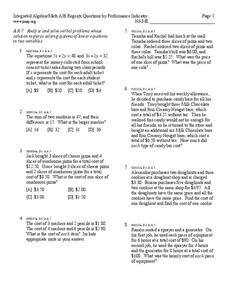
In this algebra activity, students solve linear equations and graph their answer. They add and subtract integers and compare them using a number line. There are 15 questions with an answer key.
Georgia Department of Education
Math Class
Young analysts use real (provided) data from a class's test scores to practice using statistical tools. Not only do learners calculate measures of center and spread (including mean, median, deviation, and IQ range), but also use this...
Curated OER
Can you Find the Expression
Students collect data from measurements and weights for this experiment. In this algebra lesson, students analyze graphs they create form their data to find the expression representing the data. They label which graph provided the best...
Curated OER
Positive Future Fair Project
Ninth graders view the film "Pay It Forward" and discuss what kind of public campaign is needed to move people to positive action. They consider different ways of presenting information (graphs, visual displays, etc.) as tools for...
Curated OER
Leap Frog Experiment
Second graders ask questions and design an experiment to explore different spinners in "The Leap Frog" board game. They conduct their experiment, collect information and interpret the results using a graph.
Curated OER
Jelly Belly: What a Wonderful "Bean"!
Students explore how jelly beans are produced. They discuss the origins of the jelly bean and view a video about how jelly beans are prepared, tested, shaped, finished, and shipped and estimate the amount of jelly beans in a jar and sort...
Curated OER
Keep It Cool
Pupils complete a science experiment to study insulation, heat transfer, and permafrost. In this permafrost study lesson, students design and test a soda insulator. Pupils graph their class data and discuss the results. Students discuss...
Curated OER
Saving Money Through Mathematics
Third graders discuss light sources and collect data about energy sources. They compare data and create a multiple line graph showing energy used by light sources for each student in the group. They present their graphs and write a...
Curated OER
Butterflies in the Garden
Students estimate the population of a butterfly ecosystem and create a chart and graph based on information they find.
Curated OER
Mathematical Models with Applications: The Sounds of Music
Pupils use an electronic data-collection device to model the sound produced by a guitar string. They identify the graph of a periodic situation and use the graph to determine the period and frequency of sound waves.
Curated OER
Car Maze competition
Young scholars use graphs to calibrate an RCX car. They must then program the car to traverse a maze using their calibrations
Curated OER
Baseball - America's Pastime
Students complete Internet research about baseball and baseball players. They complete a variety of activities including writing an epitaph for Jackie Robinson, a news article about him, and make graphs displaying salaries of a number of...
Curated OER
How Far Will It Roll?
Learners construct a car with the longest roll using a ramp. They construct Lego cars, modify the wheel sizes and car configurations to evaluate which car design rolls the longest distance, develop a graph, and complete a worksheet.
Curated OER
Statistics Newscast in Math Class
Students study sports teams, gather data about the teams, and create a newscast about their data. In this sports analysis instructional activity, students research two teams and define their statistical data. Students compare the two...
Curated OER
Using Diagrams in Problem Solutions
Students use tables, graphs and diagrams to collect data. In this problem solving with diagrams lesson plan, students construct their own tables and graphs containing information they gather from a drawing. They also make a Venn Diagram...
Curated OER
Climate Types
In this weather learning exercise, students describe the rainfall distribution found in two different areas of the world. Then they compare the various types of climates found around the world using the graphs shown on the sheet.
Curated OER
Morning Math / Homework Math
In this math worksheet, students complete ten exercises reviewing basic math skills related to place value, money, time, number sense, and graphing. A Homework Math sheet is also included reviewing the same skills.
Curated OER
Catching Some Rays
Sixth graders explore the tilt of Earth's axis. In this Earth lesson, 6th graders read a Greek mythology story explaining why there are seasons. Students build a sun-ray gathering tool from styrofoam, glue, thermometers, skewers, and...
Curated OER
Graphing the Past Using Today's Technology
Eighth graders research and gather information from such sources as Microsoft Encarta, World Wide Web sites, and other sources using computer software to collect data.
Curated OER
Writing Linear Equations
In this math worksheet, learners write the equations in slope intercept form for the equations that are graphed. They also create equations using slope and intercepts.
Curated OER
Two Variable Inequalities
In this algebra worksheet, students solve inequalities using addition, subtractions and multiplication. They graph the inequalities with shading. There are 2 questions.
Curated OER
Worksheet 16 - Spring 1996
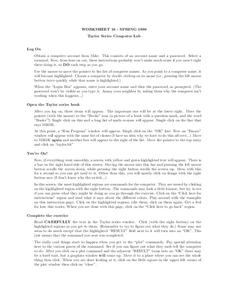
In this math worksheet, students read the instructions for setting up a computer program. Then they practice graphing the functions with the software program.
Curated OER
Determination of Tensile Stress-Strain Common Properties in Materials
Young scholars demonstrate the relationship between stress and strain, then graph stress-strain curves for various common materials. Students interpret graphed results and discuss differences in mechanical properties of materials.
Other popular searches
- Bar and Line Graphs
- Bar Circle Line Graph
- Bar Graphs Line Graphs
- Bar, Line, Circle Graphs
- Bar Line Circle Graphs
- Bar Graphs and Line Graphs
- Bar Graphs, Line Graphs
- Bar Line Graphing
- Bar Line Graphs
- Bar Line Graph Unit
- Bar, Line, and Circle Graphs
- Bar & Line Graphs


