Curated OER
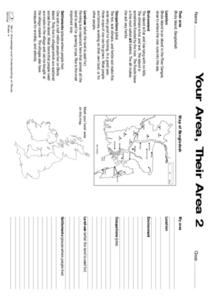
Your Area, Their Area
In this Your Area, Their Area worksheet, learners locate and identify an area on a map, then write short answers to factors about it. They then create a poster with materials provided.
Curated OER
Weather in Your City
Students observe weather conditions of a particular city. Multiple intelligences are explored within this lesson. They locate their particular city on a United States map. Each student writes about their discoveries in his/her journal...
Curated OER
Energy Efficient Buildings
Seventh graders create plans for an energy efficient addition to the school. They work in small groups with each group having responsibility for examining one aspect of the problem. They create working diagrams and a model of their...
Curated OER
Mummy Dearest
Students assess what environmental conditions best contribute to preservation and mummification by participating in a multi-day 'apple mummification' lab.
Curated OER
"Measurement in Motion"
Ninth graders examine the rate of motion and changes in motion using a ramp and a rolling object. They conduct the demonstration, determine the average speed, and describe how a moving object can have zero acceleration and deceleration.
Curated OER
How Has Math Evolved?
Eighth graders pick a topic or person to research related to the history of mathematics. They brainstorm and create a concept map, using the multimedia software inspiration, about what they are researching and want to examine. They then...
Curated OER
Lessons for Atlatl Users with Some Experience-Grade 5
Fifth graders throw darts, collecting data for distance traveled. For this data analysis lesson, 5th graders throw a dart using an atlatl. They calculate the speed for each throw and determine the best dart length for distance throws.
Curated OER
Box-and-Whisker Plots
Eighth graders measure in feet and inches and convert to explore the relationship between the converted measurements. In this measurement lesson plan, 8th graders use the whisker and box plot to represent the measurement of a cat. ...
Curated OER
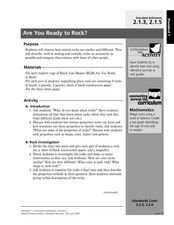
Are You Ready to Rock?
Second graders investigate rock samples using magnifying class. In this earth science lesson, 2nd graders identify the physical properties and describe them verbally with their partners. They compare their findings with the class.
Curated OER
Food Pyramid Power: Looking Back and Moving Forward
Students show their knowledge of properties of objects as it pertains to sorting and creating patterns. In this food pyramid power lesson plan, students show their ability to use whole numbers in different representations by appling...
Curated OER
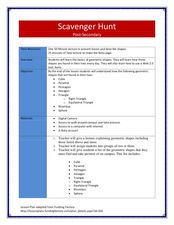
Scavenger Hunt
Young scholars collect data about lighting conditions around a room using a light sensor and RCX. They use software to upload and analyze the data in order to draw conclusions about light intensity in the room.
Curated OER
Measurement: Using the balance
Students use a balance and gram cubes to measure several different objects. They then record their results on a data chart and answer questions about them.
Curated OER
Hey, Look Me Over!
Students make observations about mealworms using hand lenses, rulers, and cotton swabs. Students complete their own mealworm observation chart, then they share their observations with the class. This is one station out of five in an...
Curated OER
Do You See What I See?
Pupils hypothesize the role of rocks, soil, and water by observing a terrarium and create a model to explore the water cycle. This is part of a five station set up.
Curated OER
Up, Up, and Away
Students create a model to explore the water cycle. Students also perform different experiments to witness water changing from a liquid to a gas. Students are asked to if they can find ways for water to go away without pouring the...
Curated OER
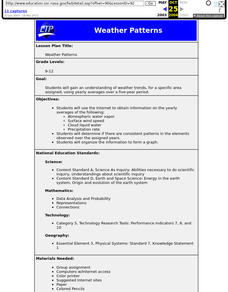
Weather Patterns
Students use yearly averages over a five-year period to understand weather trends for a specific area.
Curated OER
Student Weather Journal
Students recognize different types of cloud patterns and associate these patterns with certain types of weather. They predict the weather for the next 6 to 24 hours. They then improve their observation skills as they check on the weather...
Curated OER
Plastic Packaging
Students collect data. In this math instructional activity, students collect data about recyclable materials. Students develop a plan that will help the environment. Recycling plastic containers is discussed.
Curated OER
Range and Mode
Fifth graders interpret data. In this mode and range lesson plan, 5th graders define mode and range and practice finding them given a set of data.
Curated OER
Population Pyramids
Students create a population pyramid based on current data for their final project country. They analyze data from comprehension trends of final project country. Students analyze populations of specific countries.
Curated OER
The Dog Days of Data
Students practice an alternative form of data presentation. They practice sequencing data, identifying the stem-and-leaf, creating stem-and-leaf plots, and drawing inferences from the data by viewing the plots.
Curated OER
Climate Comparison
Students explore climate regions. In this climate lesson, students examine the climate regions of Alaska as well as the state of Hawaii. Students research selected Internet sources to gather information regarding the climates present in...
Curated OER
Pumpkin Seed Data!
Second graders work with pumpkins to estimate, then accumulate data about pumpkin seeds. After cleaning out the pumpkins, 2nd graders utilize a worksheet imbedded in this plan which has a variety of pumpkin math activities they can do.
Curated OER
Classification Introduction
Students simulate classifying rocks using different colored skittles. In this earth science activity, students create a Venn diagram according to their compiled information. They share this diagram in the class.
Other popular searches
- Bar and Line Graphs
- Bar Graphs Line Graphs
- Bar, Line, Circle Graphs
- Bar Line Circle Graphs
- Bar Graphs and Line Graphs
- Bar Graphs, Line Graphs
- Bar Line Graphs
- Bar, Line, and Circle Graphs
- Bar & Line Graphs
- Double Bar Line Graphs


