Curated OER
Dealing with Data
Seventh graders collect and analyze data. In the seventh grade data analysis lesson, 7th graders explore and/or create frequency tables, multiple bar graphs, circle graphs, pictographs, histograms, line plots, stem and leaf plots, and...
Curated OER
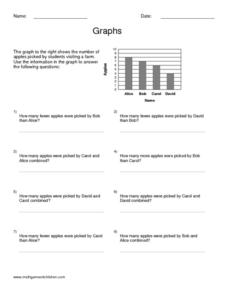
Graphs
In this algebra worksheet, students calculate the point of intersection between a circle and a straight line. There are 5 questions with an answer key.
Curated OER
Rise Over Run
High schoolers define the slope of the line, find the slope between any two points on the line, and allow them to name other areas where the slope is used. They explain why the slope is defined as the rise over the run.
Curated OER
Graphing Data
Students graph lines in a coordinate plane. In this geometry lesson, students graph lines on a coordinate plane, and identify the slope. They calculate the volume, area and perimeters of the shapes created on a coordinate plane.
Curated OER
Basic Algebra and Graphing for Electric Circuits
In this electronics worksheet, students evaluate mathematical expressions to complete 16 short answer and problem solving questions.
Curated OER
Animal Runners
In this collecting data worksheet, 4th graders use the data shown on how fast 6 animals can run to create a bar graph. Students follow the instructions on 3 directives for their bar graphs and answer 1 short answer question.
Curated OER
Linear and Quadratic Functions
In this algebra worksheet, 11th graders solve quadratic functions using the quadratic formula. They take the square roots of both side of each equation then graph both the linear and quadratic functions. There are a total of 84 problems...
Curated OER
Geometry Exam
In this reflections and symmetry worksheet, students draw lines of symmetry in shapes and patterns and reflect letters over lines in graphs. Students complete 20 problems.
Curated OER
Linear Inequalities
Students solve linear inequalities. In this solving linear inequalities lesson plan, students solve one step inequalities algebraically. Students graph the solutions on a number line. Students compare the graphs of various inequalities...
Curated OER
In A Heartbeat
Students discuss scatter plots then create a class scatter plot using their heart rate at rest and their heart rate after a few minutes of aerobic exercises. Students copy the points plotted as a class and create individual graphs...
Curated OER
Shake It Up with Scatterplots
Middle schoolers identify how to use a scatterplot to compare two sets of data to determine if they are related. Then they identify and describe the definition of regression line (the "line of best fit"). Students also identify how...
Curated OER
Functions & Algebra
Students examine linear equations. In this functions and algebra lesson, students write equations in the slope-intercept form. They enter data in a graphing calculator, examine tables, and write linear equations to match the data.
Curated OER
Parabolas
Students investigate parabolas and their equations. In this parabolas and their equations lesson, students graph quadratic equations on their graphing calculator. Students find the axis of symmetry of a parabola. Students discuss the...
Curated OER
Interesting Properties of Cubic Functions to Discover Graphically or Numerically
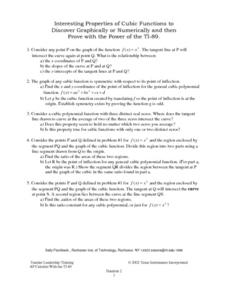
Learners investigate the slope of a cubic function. They find the tangent line of the cubic function at point P, and discuss the relationship between point P and point Q, the point the tangent line intersects the cubic function. They...
Curated OER
Quadratic Inequalities
In this quadratic inequalities worksheet, 9th graders solve and graph 10 different problems that include various forms of inequalities. First, they solve each equation shown algebraically. Then, students state the solution set of the...
Curated OER
Using Matrices for Data
For this matrices for data worksheet, 9th graders solve and complete 29 various types of problems that include using matrices to illustrate data. First, they determine the sum, difference and scalar product for each matrices shown. Then,...
Curated OER
Congruence Statements
In this congruence statements worksheet, 10th graders solve and complete 16 various types of problems. First, they complete each congruence statement listed. Then, students graph each set of points on the coordinate plane provided. They...
Curated OER
Eat Your Veggies
Students investigate displaying data. In this displaying data lesson, students use tallies to count data about food preferences. Students use various types of graphs such as bar graphs, picture graphs, box-and-whisker plots, etc to...
Math Mammoth
Slope; Math Mammoth.com
For this math activity, students find the slope of four lines when they are drawn on a coordinate grid. Students are given the slope and draw the line for two lines. They use the slope formula to find slope when given two points on a...
Curated OER
Using Tables
In this using tables learning exercise, 9th graders solve and complete 10 various types of problems that include using tables to determine information. First, they write an equation to determine the total amount. Then, students define...
Curated OER
Take Another Look
Seventh graders analyze different types of graphs and answer questions related to each. In this math lesson, 7th graders organize a given diagram to make it easier to interpret. They discuss why they made such changes.
Curated OER
Linear and Exponential Models
Students linearize data to determine if an exponential model is suitable. In this linearizing data to determine if an exponential model is suitable lesson, students graph the residuals of sets of data that appear to have an exponential...
Curated OER
Analysis Review Sheet
In this analysis review worksheet, students solve 3 complex inequalities, graph 2 absolute value inequalities, and write the equations for altitudes and tangent lines for 4 problems.
Curated OER
The Appearance of a Graph
Sixth graders understand that the appearance and increment used on the x and y axis in a graph change how it looks. In this graphing lesson, 6th graders work in pairs and interpret graphs using different axes. Students collect graphs...
Other popular searches
- Double Line Graphs
- Graphs. Line Graphs
- Bar and Line Graphs
- Interpreting Line Graphs
- Making Line Graphs
- Reading Line Graphs
- Analyzing Line Graphs
- Creating Line Graphs
- Number Line Graphs
- Reading Double Line Graphs
- Straight Line Graphs
- Bar Graphs Line Graphs


