Khan Academy
Khan: Lesson 5: Relationships Among Linear Equations, Lines in Coordinate Plane
This lesson focuses on the relationship between algebraic, graphical, and contextual expressions of linear equations.
PBS
Pbs: The Lowdown: Functional Relationships Between Quantities: Calculating Fuel Consumption
In these interactive visualizations, explore the relationship between calculating miles per gallon (mpg) to gallons per mile in fuel use for vehicles. Most drivers think gas usage falls linearly (in a straight line) as mpg increases. But...
Illustrative Mathematics
Illustrative Mathematics: F Le in the Billions and Linear Modeling
In this task, students are shown a table of world population data and asked to explore whether linear functions would be appropriate to model relationships within the data. Aligns with F-LE.A.1.b.
Khan Academy
Khan Academy: Linear Equations Word Problems: Tables
Solve word problems about real world relationships that are given in tables.
TeachEngineering
Teach Engineering: Linear Regression of Bmd Scanners
Students complete an exercise showing logarithmic relationships and examine how to find the linear regression of data that does not seem linear upon initial examination. They relate number of BMD scanners to time.
Texas Instruments
Texas Instruments: Intersecting Lines and Vertical Angles
In this activity, students visualize and explore the angles that are formed when two lines intersect. By measuring angles formed by intersecting lines, they enhance their understanding of vertical angles, supplementary angles, and a...
Khan Academy
Khan: Lsn 8: Interpreting Relationships in Scatterplots/graphs/tables/equations
This lesson focuses on Interpreting and analyzing linear, quadratic, and exponential models and graphs. Students will use best fit lines to interpret contexts, distinguish whether contexts are linear or exponential functions, use the...
Khan Academy
Khan Academy: Algebra: Comparing Linear Functions Word Problems
Compare features of two real-world relationships that can be modeled by linear functions, where the functions are represented in different ways. Students receive immediate feedback and have the opportunity to try questions repeatedly,...
Khan Academy
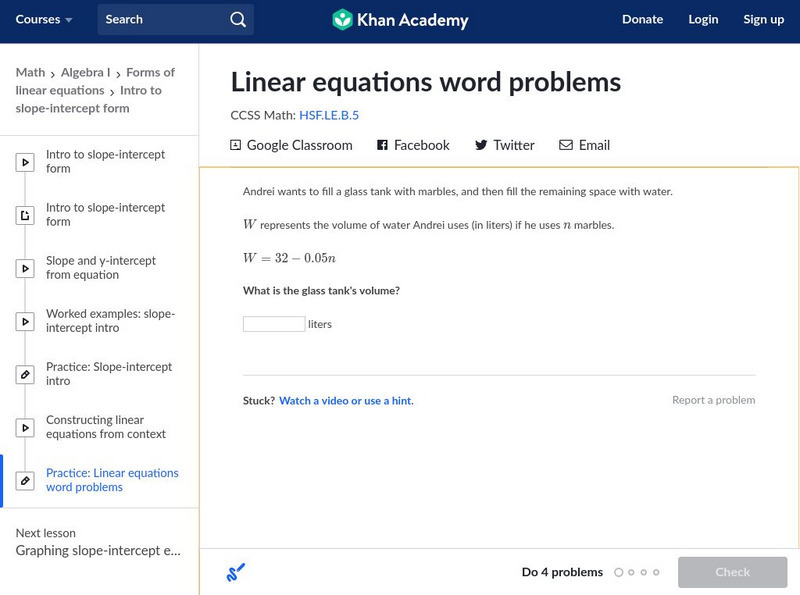
Khan Academy: Algebra I: Linear Equations Word Problems
Solve word problems about real world relationships that are given in formulas. Students receive immediate feedback and have the opportunity to try questions repeatedly, watch a video or receive hints.
Khan Academy
Khan Academy: Algebra I: Exponential vs. Linear Growth Over Time
Practice analyzing the end behavior of two functions that model similar real-world relationships, where one function is exponential and the other is polynomial. Students receive immediate feedback and have the opportunity to try...
Illustrative Mathematics
Illustrative Mathematics: S Id Coffee and Crime
This task addresses many standards regarding the description and analysis of bivariate quantitative data, including regression and correlation. Given a scatter plot, students will answer a variety of questions about linear relationships,...
Other
International Linear Collider: Possible Benefits From Ilc Technology
Research with linear colliders may enormously benefit fields such as medicine, computing and the environment. Examples include medical proton therapy and the potential of being able to render nuclear waste harmless. A wonderful side...
Other
Nearpod: Two Variable Inequalities
In this lesson, students will graph linear inequalities and determine the solution set.
Texas Instruments
Texas Instruments: Getting Started With the Ti Navigator: If the Line Fits
This lesson introduces students to Activity Center and introduces students to the use of symbolic algebra to represent real world situations. They will use Activity Center to contribute equations that model a linear relationship and then...
Texas Instruments
Texas Instruments: Inequalities, They Are Not Just Linear Anymore!
Students study quadratic relationships and explore the process of graphing quadratic inequalities and systems of quadratic inequalities. They will solve these inequalities algebraically and graph them on a coordinate plane.
Texas Education Agency
Texas Gateway: Writing Verbal Descriptions of Functional Relationships
Given a problem situation containing a functional relationship, the student will verbally describe the functional relationship that exists.
National Institute of Standards and Technology (NIST)
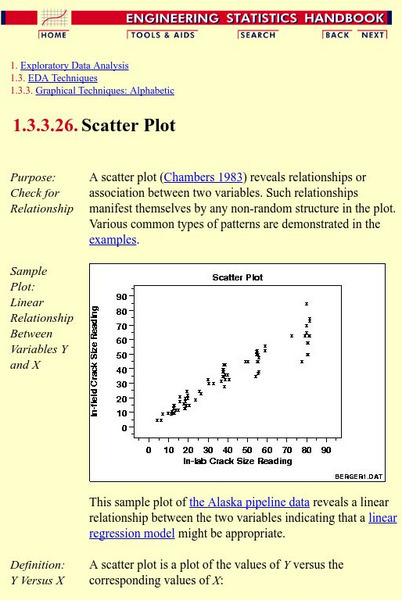
Nist: Engineering Statistics Handbook: Scatter Plots and Linear Regression
An explanation of scatter plots followed by examples of the many different kinds of scatter plots.
Illustrative Mathematics
Illustrative Mathematics: F Le Us Population 1982 1988
In this task, students are shown a table of U.S. population data between 1982 and 1988 and are asked to explore whether linear functions would be appropriate to model relationships within the data. Aligns with F-LE.B.5 and F-LE.A.1.b.
Khan Academy
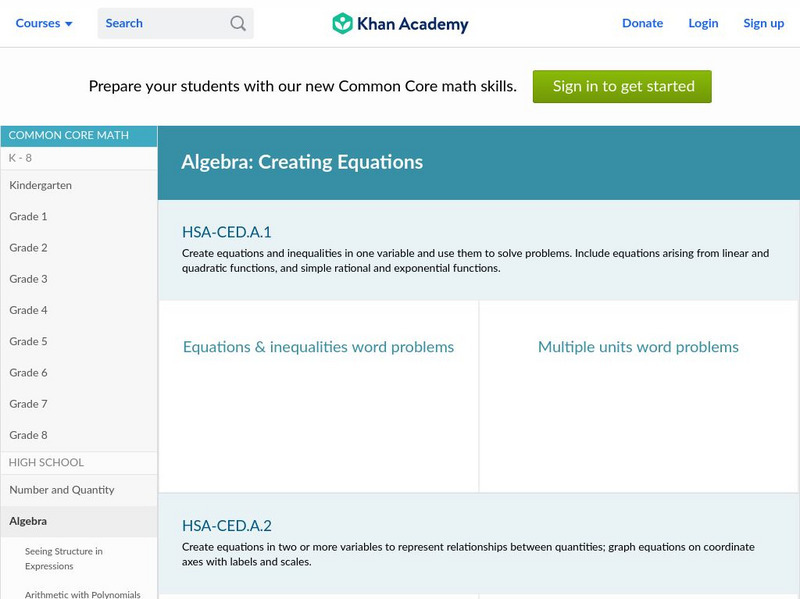
Khan Academy: Equations & Inequalities Word Problems
HSA-CED.A.1: Interactive resource which create equations and inequalities in one variable and use them to solve problems. Include equations arising from linear and quadratic functions, and simple rational and exponential functions....
Texas Instruments
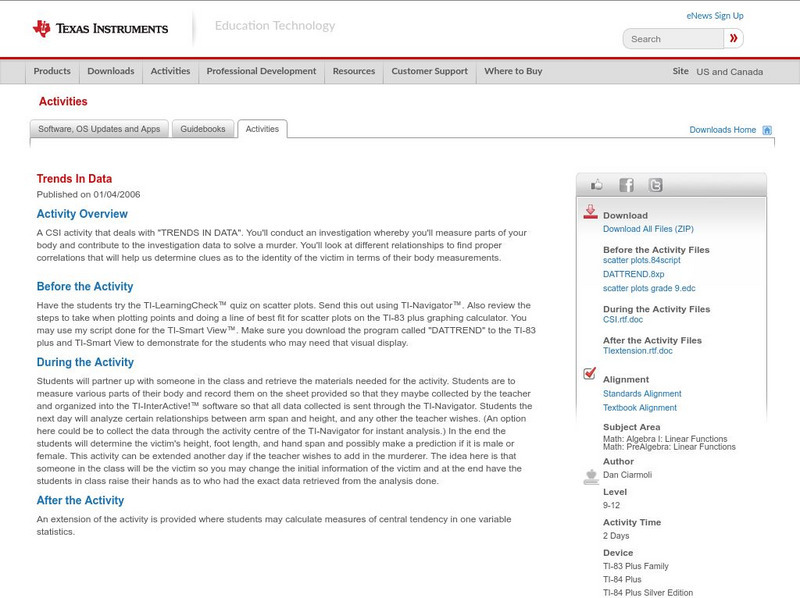
Texas Instruments: Trends in Data
A CSI activity that deals with "TRENDS IN DATA". You'll conduct an investigation whereby you'll measure parts of your body and contribute to the investigation data to solve a murder. You'll look at different relationships to find proper...
Texas Instruments
Texas Instruments: Composing Music Mathematically
This activity is designed to motivate and challenge first year algebra students through a fun introduction to advanced mathematical concepts. It also offers extensions for upper grade level students. Students will recognize relationships...
Khan Academy
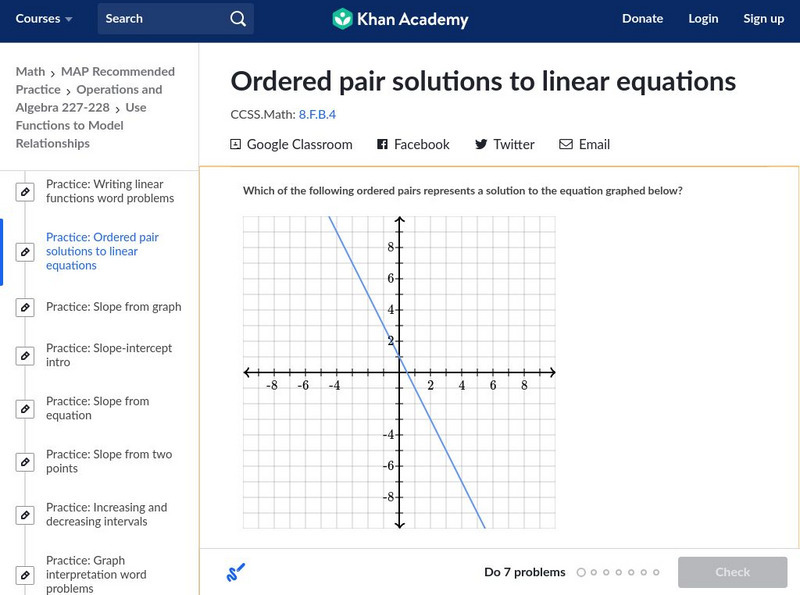
Khan Academy: Ordered Pair Solutions to Linear Equations
Determine which ordered pair represents a solution to a graph or equation. Students receive immediate feedback and have the opportunity to try questions repeatedly, watch a video or receive hints.
Texas Instruments
Texas Instruments: Describing Bivariate Data (Two Quantitative Variables)
Students explore the relationship between two quantitative variables in bivariate data using various x-y plots. They compare the relationships for several categories on the same plot. Students calculate the correlation coefficient to...
Illustrative Mathematics
Illustrative Mathematics: S Id.6 Used Subaru Foresters
Help Jane sell her Forrester! Using the data given, students will make an appropriate plot with well-labeled axes that would allow you to see if there is a relationship between price and age and between price and mileage. Students are...
Other popular searches
- Rates Linear Relationships
- Linear Pair of Angles
- Geometry Linear Pair
- Linear Pair Postulate
- Graphing Linear Relationships
- Non Linear Relationships


