EngageNY
Using Sample Data to Compare the Means of Two or More Populations
Determine whether there is a difference between two grades. Teams generate random samples of two grade levels of individuals. Groups use the mean absolute deviation to determine whether there is a meaningful difference between the...
Curated OER
Reading Comprehension: Jamaica Louise James
In this reading comprehension worksheet, students cut out 5 bookmarks. Each bookmark focuses on a story element in the book Jamaica Louise James by Amy Hest. Students answer the questions on the bookmarks. Included are: making...
Curated OER
Maniac Magee: Questions to Foster Discussion
This resource provides 11 short answer questions and a couple of extension ideas related to part one of Jerry Spinelli's novel about a feisty runaway. Not reproducible, but the questions (which address vocabulary, inference, recall,...
UAF Geophysical Institute
System Interactions: The Lorax and the Truffula Tree
If the Lorax were to write a letter, what would he write? Introduce your class to systems and feedback loops through the whimsical stylings of Dr. Seuss. Learners take on the Lorax's point of view to write a letter, among other activities.
Statistics Education Web
Consuming Cola
Caffeine affects your heart rate — or does it? Learners study experimental design while conducting their own experiment. They collect heart rate data after drinking a caffeinated beverage, create a box plot, and draw conclusions. They...
California Education Partners
We Are The Ship
An assessment sheds light on scholars' ability to read, gather evidence, and draft an original written composition. Learners read an informative text twice before taking notes and discussing their thoughts and textual evidence with a...
California Education Partners
Frog and Toad Together by Arnold Lobel
A three-part assessment tests scholars' reading and writing capabilities. Young readers listen to and read an excerpt from Frog and Toad Together by Arnold Lobel. After drawing pictures of what is memorable, learners discuss their notes...
University of Georgia
Freezing and Melting of Water
Examine the behavior of energy as water freezes and melts. An engaging activity provides a hands-on experience to learners. Collaborative groups collect data and analyze the graphs of the temperature of water as it freezes and then...
Statistics Education Web
Text Messaging is Time Consuming! What Gives?
The more you text, the less you study. Have classes test this hypothesis or another question related to text messages. Using real data, learners use technology to create a scatter plot and calculate a regression line. They create a dot...
Google
Surveys and Estimating Large Quantities
Looking for an estimation activity a bit more involved than the typical "guess the number of jellybeans in the jar" game? Here, learners use a picture to estimate the number of people at a large event, look for potential problems with...
Curated OER
Outer Space
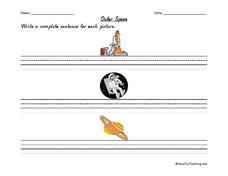
In this space worksheet, students write a sentence for each picture. The pictures show a space shuttle, an astronaut, and a planet.
Curated OER
Something is Different: Same/Different
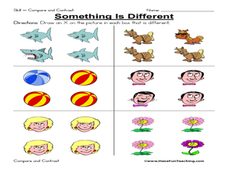
In this different/same worksheet, student draw an X on the picture in a box that is different from the others, 6 sets total. A reference web site is given for additional activities.


