Curated OER
No Title
Sixth graders, after reviewing and studying the basics of recording, analyzing and presenting data, create on graph paper a bar or line graph to represent given data and then interpret the data. They answer questions about the given data...
Curated OER
How Has Math Evolved?
Eighth graders pick a topic or person to research related to the history of mathematics. They brainstorm and create a concept map, using the multimedia software inspiration, about what they are researching and want to examine. They then...
Curated OER
Data Analysis of Ground Level Ozone
Sixth graders construct and interpret graphs from ozone data collected in Phoenix area. Can be adapted to other areas.
Curated OER
WHAT IS THE POPULAR COLOR?
Fourth graders graph cars according to their colors. They complete the graph including a title, scale, x-axis, and y-axis. Students collect the data and choose the type of graph to be made.
Curated OER
Getting Graphs: Researching Genealogy-A Piece of Pie
Third graders research their genealogy. In this math lesson, 3rd graders collect data and create graphs and charts. A presentation of their findings is given.
Curated OER
Skittles, Taste the Rainbow
Fifth graders learn and then demonstrate their knowledge of a bar and a circle graph using the classroom data. Students are given a pack of skittles candy. Students create a bar and circle graph indicating the results of the contents of...
Curated OER
Line & Scatter (What Would You Use: Part 2)
Learners discuss line graphs and scatter plots and the best situations in which to use them. Using the graphs, they determine the type of correlation between variables on a scatterplot. They create a scatterplot and line graph from a...
Curated OER
Data Collection and Presentation
Students concentrate on discrete quantiative data. They are shown that the vertical line diagram as a more appropriate way to present discrete quantiative data then bar charts. Students work as a group to help with the interpretation...
Curated OER
Investigating Median, Mode, and Mean
Students develop strategies to organize data while following teacher demonstration. They calculate the mean, median and mode of a data set while determining the relationships between the numbers. They analyze data from tables and double...
Curated OER
Meet The Graphs
Learners identify two types of graphs. They analyze and interpret authentic data shown in bar and pie graphs and complete a graph given specific data. Perform simple functions within an Excel document:
Curated OER
Math & Social Science
Students are given data and are to calculate averages and yearly totals of how many cars travel the Tacoma Narrows Bridge. They also make a graph of the data.
Curated OER
How's The Weather?
Students make a box and whiskers plot using the TI-73 graphing calculator. Each student would have their own calculator but they would work in small groups of two or three to help each other enter the data and make the plots.
Curated OER
Finding Equations
Students make equations from everyday data. They create a graph from the equations. Students predict and analyze the results. Students complete the second scenario on their own and turn in their handout.
Curated OER
Recording Frequency
First graders analyze nursery rhymes and gather data about word frequency. In this frequency lesson, 1st graders create graphs and tables. Students interpret the data.
Curated OER
French Fry Fun: Estimating and Measuring
Third graders demonstrate their estimating and measuring abilities. In this length measurement lesson, 3rd graders produce estimates of how long a handful of French fries will be before physically measuring them. Students graph their...
Curated OER
Count On It!
Students investigate money. In this consumer math lesson, students use coins, identify their value, then group them in various ways to equal a dollar.
Curated OER
Show Me!
Students analyze and interpret graphs. In this graphing lesson, students view a video and construct their own graphs (line, circle, bar) from given sets of data.
Curated OER
Technology Literacy Challenge Grant Learning Unit
First graders explore counting and classification. They sort leaves, create graphs, write sentences for the data in the graphs, develop graphs for shapes, favorite animals, birthdays, and participate in a die prediction game.
Curated OER
French Fry Run
Student explore estimation and measurement. In this measurement lesson, 2nd graders measure french fries, graph their data, and determine the size of french fries that is the best value. Students practice how to add prices and calculate ...
Curated OER
Local Traffic Survey
Young scholars conduct a traffic survey and interpret their data and use graphs and charts to display their results.
Curated OER
A Thanksgiving Survey
Students take a survey then use the information gained from the survey to help plan a typical Thanksgiving dinner for our last day of class. They create a graph which corresponds the the data gathered during interviews.
Curated OER
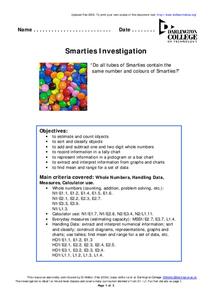
Smarties Investigation
In this math worksheet, students participate in an investigation of Smarties candy. For example, students estimate how many candies they have in each color, count the actual number, and record the information in a tally chart.
Curated OER
Tracking Olympic Gold!
Students use print or online resources to track the results of the Olympic Games, record daily results on graphs, use graphs to collect information.
Curated OER
All in the Family
Learners use data to make a tally chart and a line plot. They find the maximum, minimum, range, median, and mode of the data. Following the video portion of the lesson, students will visit a Web site to test their data collection skills...


