Curated OER
New York State Testing Program: Mathematics Book 2, Grade 4 2003
In this 4th grade math standardized test practice worksheet, students solve 48 multiple-step open-ended math problems based on New York academic standards.
Curated OER
Range and Mode
In this data interpretation worksheet, 2nd graders review the definitions of range and mode. They use the information from a data table to answer 5 questions about the children in after-school clubs.
Curated OER
Investigating Median, Mode, and Mean
Students develop strategies to organize data while following teacher demonstration. They calculate the mean, median and mode of a data set while determining the relationships between the numbers. They analyze data from tables and double...
Curated OER
Lesson Plan 2: Linear Inequalities
Students investigate linear inequalities and the associated symbols. After a teacher demonstration, they translate given phrases into symbols. Students solve and graph solutions to linear inequalities. Using newspapers, they locate...
Curated OER
Mean, Median, Mode, and Range: Reteach
For this line plots worksheet, students review how to make a line plot to show data and review the steps to find mean, median, mode, and range. Students then make a line plot for the data in exercise 1 and use it to answer the remaining...
Curated OER
Customary Units of Weight Homework 13.7
In this customary units of weight, students choose the unit that would be most appropriate to measure the weight of 11 objects- either ounces or pounds.
Curated OER
Range and Mode
Students interpret data from graphs. In this range and mode activity, students review a tally chart, pictograph and bar graph. Students use these graphs to calculate the range and mode of each set of data.
Curated OER
Mean, Median and Mode
Fourth graders describe weather data using the mean, median and mode. In this mean, median and mode lesson, 4th graders understand how to calculate data using mean, median and mode and why they would use each one.
Curated OER
Charting Animal Life Spans
Second graders research animal life spans and complete related math activities. In this life span lesson, 2nd graders read How Many Candles and discuss life spans. Students arrange animal cards based on their life spans. Students find...
Curated OER
Decimal word problems
In this decimals worksheet, students complete word problems having to do with decimals up to 4 digit numbers. Students complete 10 multiple choice problems.
Curated OER
Decimals and Batting Averages #6
In this decimals and batting averages worksheet, students compute 9 batting averages to complete the chart, then answer 5 questions about the data in the chart.
Curated OER
Quiz: Comparing and Ordering Whole Numbers
For this whole numbers worksheet, 5th graders compare and order 10 sets of numbers. Each number ranges from four to eight digits. Students must read a table and read numbers in word form as well.
Curated OER
Decimals: Writing, Comparing and Ordering
In this decimals: writing, comparing and ordering worksheet, 6th graders use a place value chart to write decimals in standard, expand and word form, to compare by writing > or < , and to put a list of decimals numbers in order.
Curated OER
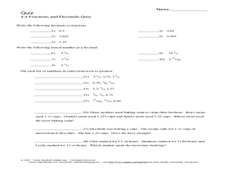
Quiz on Fraction and Decimals
In this quiz on fractions and decimals worksheet, 6th graders change decimals to fractions, fractions to decimals, put lists of numbers in order and answer 3 word problems.
Curated OER
Student Heights
Students measure the heights of their fellow classmates and create a box and whisker plot to display the data. In this measurement lesson plan, students analyze the data and record results.
Curated OER
Bar Graphs and Data Analysis
In this graphing worksheet, students look at a bar graph of allowance and dollars. They answer 6 questions related to the bar graph.
Curated OER
Building Venn Diagrams
Young scholars use Venn diagrams to solve prime number and factorization problems. In this multiplication lesson, students watch a video and use a Venn Diagram to help them solve a pizza math activity that uses prime factorization. Young...
Curated OER
What Is Perimeter?
In this geometry worksheet, students read the definition of and the algorithm for finding the perimeter of a rectangle. They find the perimeter of 8 rectangles before ordering 4 items from the greatest perimeter to the least.
Curated OER
Using Data
In this analyzing data worksheet, 4th graders read, study and interpret a bar graph on how many hours Millie spends a week drawing each day. Students answer 2 short answer questions relating to the bar graph.
Curated OER
Math: How Many Ways Can You Find the Middle?
Twelfth graders find the mean, median, and modes of stacks of Lego blocks, They search in newspapers for real life applications of them. They present oral reports on what they have learned.
Curated OER
Ordering Numbers
In this ordering numbers worksheet, students complete a set of 8 practice problems which include the tasks of ordering fractions, negative numbers and whole numbers.
Curated OER
Applying Prime Factorization
Sixth graders use the prime factorization of numbers to find the greatest common factor and least common multiple. Working in small groups, they solve problems using the greatest common factor and least common multiple.
Curated OER
Factors and Multiples
Sixth graders need to see the relevance in the mathematics they learn. This lesson builds on the concepts of least common multiple and greatest common factor. The lesson presents real-world problem situations for students to solve.
Curated OER
Skittle Graphing (Lesson Plan)
Students discuss the uses of graphs. They use color candies to count and sort before designing graphs. They label the graph papers with appropriate titles and candy colors. They complete the graph bars, and discuss the results with a...


