Curated OER
Population Pyramids
Students create a population pyramid based on current data for their final project country. They analyze data from comprehension trends of final project country. Students analyze populations of specific countries.
Curated OER
Tolerance
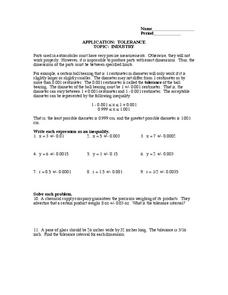
In this tolerance worksheet, 9th graders solve and complete 11 different problems that include determining exact measurements. First, they write each expression as an inequality. Then, students determine the tolerance interval of a...
Curated OER
Customary Units of Weight Practice 13.7
In this customary weights worksheet, students solve 13 problems in which the weights of objects are estimated, ordered and converted. All are standard units of weight.
Curated OER
African-American Inventors
Students conduct research on a variety of African-American inventors. They choose an invention that they feel has had the greatest impact on the world today and write a short summary of the invention, its impact and the inventor's...
Curated OER
Temperature
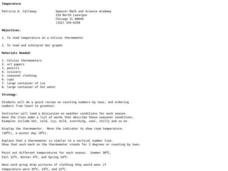
Learners explore the concept of temperature. In this temperature lesson, students read thermometers in degrees Celsius. Learners discuss the temperature of the seasons and what clothing they might wear given a certain temperature....
Curated OER
Investigate Perimeter
In this perimeter instructional activity, students are given perimeter and draw 3 different squares or rectangles on given grids, using those given measurements, then complete 2 related questions.
Curated OER
Fractions: comparing and ordering
In this fractions activity, students compare 2 fractions and order a set of fractions. Students complete 8 comparing and 4 ordering problems.
Curated OER
Decimals test
In this decimals activity, students complete a test asking them questions on rounding, sums, and metric units involving decimals. Students complete 20 problems.
Curated OER
Great Tasting Shapes
Fifth graders investigate the concept of median, mode, and range using a simple model for display purposes. They examine different shaped crackers out of a box and identify the ones that occur the most. Then the calculations for the...
Curated OER
Mean and Median
Students define mean and median. In this "average" lesson, students calculate the mean and median for a list of given numbers.
Curated OER
Fractions, Decimals, and Percents
In this middle school mathematics worksheet, students convert between fractions, decimals, and percents in problem solving situations. The one page worksheet contains ten problems. Answers are included.
Curated OER
SAT Grid Ins Practice Test 05
In this SAT practice test worksheet, 12th graders answer 10 short answer questions. Questions are from a variety of topics, but mainly ask about geometry concepts. The test is self-scoring.
Curated OER
Integrated Algebra Practice: Frequency Histograms, Bar Graphs and Tables
In this graphs worksheet, students solve 4 problems about histograms, bar graphs, and tables. Students answer questions about histograms, bar graphs, and tables.
Curated OER
Data Analysis and Probability
Students make their own puzzle grid that illustrates the number of sit-ups students in a gym class did in one minute, then they make a histogram for this same data. Then they title their graph and label the scales and axes and graph the...
Curated OER
Measuring Soil Temperatures at South Penquite Farm
Learners investigate soil temperatures. In this graphing and earth science lesson, students insert temperature probes into different types of soil at varying depths. Learners complete a data chart and construct a related graph...
Curated OER
Smile Metric Style
Students measure the length of student smiles and then record, order and graph their results.
Curated OER
Measuring Volume, Standard and Metric
In this measuring volume, standard and metric worksheet, 3rd graders solve ten multiple choice problems about volume, answers are available on line.
Curated OER
Piece of the Sky: Introduction for Making S'COOL Observations
Learners observe and discuss cloud cover. They identify percent of cloud cover, calculate cloud cover by fraction and convert to a percent, and compare their models with the current real sky cloud cover.
Curated OER
Describing Data
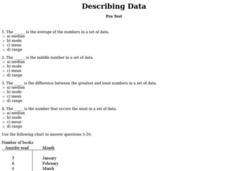
For this describing data worksheet, students answer multiple choice questions about mean, median, mode, and range. Students complete 10 questions total.
Curated OER
Multiples Worksheet (2 of 2)
In this multiples practice worksheet, students examine eight 1 and 2-digit numbers. Students record the first 8 multiples for each of the numbers. An example is provided.
Curated OER
Describing Data
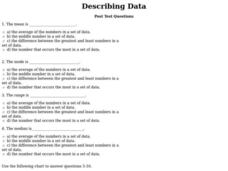
In this data activity, students complete multiple choice questions about mean, median, mode, and range. Students complete 10 questions total.
Curated OER
New York State Testing Program Mathematics Grade 7
For this seventh grade worksheet, 7th graders assess their knowledge and understanding of grade level mathematics. The twenty-two page worksheet contains thirty multiple choice questions. Answers are not provided.
Curated OER
Teaching Money
Students identify coin/money values, write amounts of money and calculate change. The poem, "Smart" by Shel Silverstein is used in this lesson.
Curated OER
Word Power
Fifth graders identify a set of data from a real world problem. For this statistics lesson, 5th graders identify the range, mode, median and mean using some manipulatives. They write words randomizing the letters.


