Curated OER
Counting Principle
Students identify the different outcomes given a situation. For this algebra lesson, students calculate the possible outcome using the counting principle. They compare and analyze patterns to make their predictions.
Curated OER
The Big E
Sixth graders explore predictions and estimation. In this math lesson, 6th graders analyze data and make predictions based on the past years data.
Curated OER
You May Already Be a Winner!
Second graders flip coins and tally the outcomes. They play the You May Already Be a Winner! game with cards under their chairs. Some cards are winners, some might be and the others are not. They play to explain the probability concept.
Curated OER
Data Analysis Using Technology
Analyze data using technology. Middle schoolers design data investigations, describe data, and draw their own conclusions. Then they select the best type of graph, graph and interpret the data, and look for patterns in trends. They also...
Curated OER
Creating a Thematic Map Using S'COOL Data
Students observe weather patterns, collect data, and make a weather predictions for various locations on a map.
Curated OER
Math: Reaching New Heights
Pupils apply math skills to assess the range, mean, mode, and median of data sets. Using a "Reaching New Heights" worksheet, they review and discuss how to calculate the answers. Students write complete explanations of all their...
Curated OER
How Quickly Disease Spreads
Young scholars demonstrate how quickly disease spreads and the importance of protective measures with communicable diseases. They examine past epidemics such as the Bubonic Plague and make predictions about future epidemics.They compare...
Curated OER
Patterns
Fourth graders investigate patterns and sequences. In this patterns and sequences lesson, 4th graders use a hundreds chart to build recurring patterns. Students skip count by threes and fives on a hundreds chart by coloring...
Curated OER
Pika Chew
Students work in collaborative teams with specific roles, use the Internet to research the behavior and ecology of pikas, make predictions about survival rates of pikas in different habitats and organize their data in graphs.
Curated OER
Problem Solving
Second graders practice problem solving strategies. For this problem solving lesson, 2nd graders use strategies such as guess and check, acting out, drawing pictures and looking for patterns to solve problems. Students work in groups to...
Curated OER
Experimental Probability (Practice 20.5)
In this probability activity, students make a set of cards with letters (instructions provided) and use them to solve 5 probability investigations.
Curated OER
Managing Nutrients in Livestock Manure
Livestock managers reinforce math and science skills while learning about the nutrients found in manure. They predict which animal produces the largest amount and which animal's manure contains the most nitrogen. Finally, they compare...
Curated OER
Working Watermelon
You're going to wish you had a watermelon for this lesson! Class members read about watermelons and make a salad in class to sample. They also perform estimates, measurements and calculations on a watermelon. They predict what percentage...
Curated OER
You Won The Prize
In this math worksheet, students use the laws of probability in order to make predictions about the average and future outcomes in the word problems.
Curated OER
Computation and Estimation
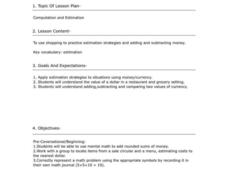
Students read "Moosey Saves Money" and use mental math to determine if Moosey is saving any money. In this math computation and estimation lesson, students discuss the story in relation to saving money, recording in their math journal....
Curated OER
How High Are the Clouds?
Students analyze height and collect data to create a graph. In this statistics lesson, students use central tendencies to analyze their data and make predictions. They apply concept of statistics to other areas of academics to make a...
Curated OER
What are the Chances: A Game of Chance!
Sixth graders experiment with dice, playing cards, pennies and computer-generated simulations to calculate probability. They use compiled data to make predictions.
Curated OER
Graphing Scatterplots
Young scholars examine scatterplots and determine the equation of a line using the slope-intercept method. Students interpret graphs, draw inferences, and sketch a curve of best fit for the graph. Based upon patterns in the graphs,...
Curated OER
Trends of Snow Cover and Temperature in Alaska
Students compare NASA satellite data observations with student surface measurements of snow cover and temperature. They practice data collection, data correlations, and making scientific predictions.
Curated OER
Equations
In these equation worksheets, students solve 2 multi-step word problems. Students must set and solve equations as well as make predictions given their equations.
Alabama Learning Exchange
I'm so Crushed
As an experiment is demonstrated for them, students write down their observations and brainstorm questions that can help them understand what they saw. After watching the experiment again—which demonstrates a soda can collapsing due to...
Curated OER
Graph Creator
Learners rewrite equations using algebraic symbols. In this algebra lesson, students graph linear equations using the slope and y intercept. They make predictions about their graphs and analyze the results.
Curated OER
Mean and Median
Pupils identify the different central tendencies. For this probability lesson, students create the correct type of graphs to analyze their data. They make predictions and draw conclusions from their data.
Curated OER
Fibonacci Patterns
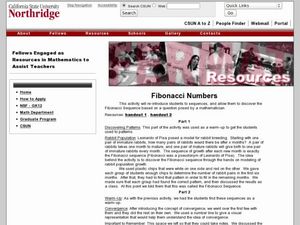
Students solve problems using the Fibonacci Patterns. In this geometry instructional activity, students trackthe growing rate of a rabbit population. They collect the data and graph their results. They make predictions based on their...
Other popular searches
- Making Predictions Math
- Pumpkin Math Predictions
- Prediction Math
- Predictions Math
- Prediction Skills in Math
- Tsunami Prediction Math


