Kenan Fellows
Lego Thinking and Building
Run a simulated airplane manufacturing plant with your pupils as the builders! Learners build Lego airplane models and collect data on the rate of production, comparing the number produced to the number defective. Using linear...
Curated OER
Multi-dimensional Modeling of Ore Bodies Making Sense of Empirical Data
Math scholars identify four different rock types in that strata and use this identification and data to construct a two dimensional geologic cross-section. They use data tables to construct a three-dimensional geologic cross-section.
Achieve
Dairy Barn
Agriculture is truly a math-based profession! Help the dairy farmer determine the supplies needed to complete his barn. Using given dimensions, learners build equations and use units to determine the correct amount of materials.
Curated OER
Dental Impressions
What an impressive task it is to make dental impressions! Pupils learn how dentists use proportional reasoning, unit conversions, and systems of equations to estimate the materials needed to make stone models of dental impressions....
5280 Math
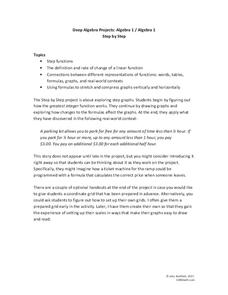
Step by Step
One step at a time! A seemingly linear relationship becomes an entirely new type of function. Young scholars build their understanding of step functions by completing a three-stage activity that incorporates multiple representations of...
Curated OER
Drawing to Scale
Students examine the process of drawing a picture to scale. They analyze and discuss real-life blueprints for a house, and create a scale drawing of an original invention using calculators and rulers.
Statistics Education Web
Are Female Hurricanes Deadlier than Male Hurricanes?
The battle of the sexes? Scholars first examine data on hurricane-related deaths and create graphical displays. They then use the data and displays to consider whether hurricanes with female names result in more deaths than hurricanes...
EngageNY
Writing and Evaluating Expressions—Exponents
Bring your young mathematicians into the fold. Scholars conduct an activity folding paper to see the relationship between the number of folds and the number of resulting layers in the 23rd installment of a 36-part module. The results of...
Ohio Department of Education
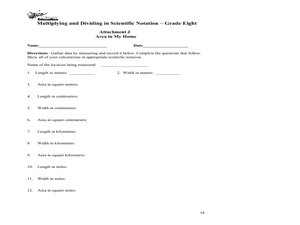
Multiplying and Dividing in Scientific Notation - Grade 8
Here is really nice set of resources on scientific notation. Eighth and ninth graders explore the concept of multiplying and dividing in scientific notation. In this multiplying and dividing numbers in scientific notation instructional...
University of Utah
Analyze and Solve Linear Equations
Solve any issues you have with solving linear equations. Learners solve linear equations in one variable, starting with two-step equations, in the first chapter of a 10-part eighth-grade workbook series. They then progress to equations...
Utah Education Network (UEN)
Linear Graphs Using Proportions and Rates
Using a TI-73 or other similar graphing calculator middle school math majors investigate the linear relationship of equivalent proportions. After a brief introduction by the teacher, class members participate in a timed pair share...
Illustrative Mathematics
Animal Populations
Assume all you know is that the variable Q represents a value that is bigger than the value represented by the variable P. Which is larger P + Q or 2P? The problems in this activity get more complex than that example, and they do a good...
Curated OER
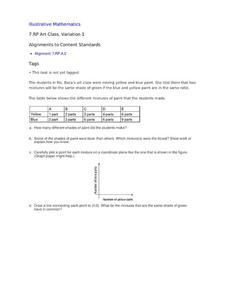
Art Class, Variation 1
Student statisticians calculate ratios to determine how many shades of green were mixed by Ms. Baca's art class. They graph the number of blue parts against the number of yellow parts for each combination and discover that some produce...
Mathematics Assessment Project
Classifying Proportion and Non-Proportion Situations
Proportions, proportions, everywhere. Class members complete an assessment task solving problems involving proportionality. They then complete an activity classifying given situations as proportional or non-proportional.
Alberta Learning
Area and Perimeter of Irregular Shapes
Evaluate young mathematicians' understanding of area and perimeter with this series of three assessment tasks. Challenging learners to not only calculate the area and perimeter of irregular shapes, but to explain in writing their...
EngageNY
Analyzing Graphs—Water Usage During a Typical Day at School
Connect your pupils to the problem by presenting a situation with which they can identify. Individuals analyze a graph of water use at a school by reasoning and making conclusions about the day. The lesson emphasizes units and labels of...
Mathematics Assessment Project
Increasing and Decreasing Quantities by a Percent
As part of a study of percent and percent change, learners first complete an assessment task with several percent change problems. They then complete an activity using cards to create a diagram expressing percent increases and decreases...
Howard County Schools
Getting Paid for School
What if you were paid to attend class? What kind of payment schedule would you choose? Learn how exponential functions will eventually exceed linear functions by comparing two different payment schedules for attending class.
Mathematics Assessment Project
Calculating Arcs and Areas of Sectors of Circles
Going around in circles trying to find a resource on sectors of circles? Here is an activity where pupils first complete an assessment task to determine the areas and perimeters of sectors of circles. They then participate in an activity...
Indian Institute of Technology
Could King Kong Exist?
The title says it all: Could King Kong exist? Investigate how increasing the dimensions of an object affects its surface area and volume to mathematically conclude whether a creature with the weight and height of King Kong could actually...
EngageNY
Interpreting the Graph of a Function
Groups sort through NASA data provided in a graphic to create a graph using uniform units and intervals. Individuals then make connections to the increasing, decreasing, and constant intervals of the graph and relate these connections...
EngageNY
Newton’s Law of Cooling
As part of an investigation of transformations of exponential functions, class members use Newton's Law of Cooling as an exponential model to determine temperature based on varying aspects. The resource makes comparisons between models...
Curated OER
Water Meter Reader
Junior high schoolers learn how to read a water meter, track their family water usage, and discuss the amount in class with other pupils. They will interpret real-world data and graph it. It is ideal for increasing awareness and...
Illustrative Mathematics
DVD Profits, Variation 1
The idea in the resource is to understand the connections between proportional relationships, lines, and linear equations. To stay within the context of the standard, skip the part of the resource that solves with unit rates. Instead,...


