Curated OER
Investigating Equations of Lines
High schoolers investigate linear equations as they use technology (Cabri, Jr.) to explore the equations of lines in slope-intercept form. The technology allows learners to manipulate the line and observe the changes in the parameters of...
Curated OER
Intersecting Lines and Vertical Angles
Pupils identify and define intersecting lines and vertical angles. They draw two intersecting lines and measure one pair of vertical angles. Learners will also move a line to change the angles of a figure and describe the changes in the...
Curated OER
Investigating the Slopes of Parallel and Perpendicular Lines
High schoolers investigate parallel and perpendicular lines. They use Cabri Jr. to construct and explore the relationships between the slopes of parallel and perpendicular lines. The drawing and measurement tools available with Cabri Jr....
Texas Instruments
Investigating Segments in a Quadrilateral
Investigate the properties of the shape formed by connecting the midpoints of adjacent sides of a quadrilateral. In this properties of the shape formed by connecting the midpoints of adjacent sides of a quadrilateral lesson, young...
Curated OER
Measuring Angles in a Quadrilateral
High schoolers explore quadrilaterals in this geometry lesson. They will draw a quadrilateral, measure the angles, and find the sum of the measures of the interior angles using Cabri Jr. The interactive capabilities of Cabri Jr. allow...
Curated OER
Investigating Segments in a Triangle
Pupils investigate segments in a triangle by constructing a triangle using Cabri Jr. They construct segments within the triangle that lie on the midpoints of the triangle's sides. Learners then compare the slope of base of the triangle...
Curated OER
Investigating Lengths of Segments in a Triangle
Pupils explore the midsegment of a triangle in the geometry lesson. They draw and measure the segment joining the midpoints of the two sides of a triangle and compare its length to the length of the third side of the triangle. The...
Curated OER
Measuring Angles in a Triangle
High schoolers investigate the sum of the measures of the angles of a triangle. They draw a triangle and measure the interior angles. Using Cabri Jr., learners find the sum of the measures of the interior angles. The instructional...
Curated OER
Two Investigations of Cubic Functions
Through learning about cubic functions, students graph cubic functions on their calculator. Students determine the local maximum and minimum points and the tangent line from the x-intercept to a point on the cubic function. Students...
Curated OER
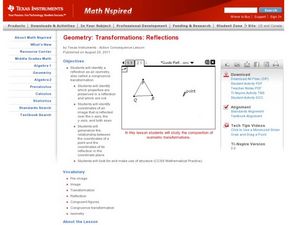
Transformations: Reflections
Students perform transformations on their graphs. In this algebra instructional activity, students identify the pre-image and image. They find and identify congruent shapes and isometry.
Curated OER
How Many Solutions 2
Students solve systems of equations. In this algebra activity, students graph lines and identify the point of intersection. They identify the function to see if it is a function.
Curated OER
Systems of Linear Inequalities
The class solves systems of linear inequalities. They graph lines and identify the point of intersection.They graph lines and identify the boundary that represent the solution and solution set.
Curated OER
Exploring Power Functions 1
Learners describe the end behavior of polynomial functions. Pupils relate the behavior of the graph to the exponent of the graph. They differentiate graphs with odd-exponent and graphs with even exponents.
Curated OER
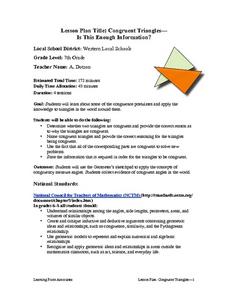
Congruent Trianges - Is This Enough Information?
Seventh graders determine whether two triangles are congruent and provide an explanation to why they are not. They apply concepts of measurement of angles and collect evidence of congruent angles in the world.
Curated OER
Bunny Cakes and Graphing
Third graders graph and analyze data relating to the book "Bunny Cakes" by Rosemary Wells. They listen to and discuss the book, vote on their favorite cake using Excel computer software, and discuss the results.
Curated OER
Shedding Light on the Weather with Relative Humidity
Learners study weather using a graphing calculator in this lesson plan. They collect data for temperature and relative humidity for every hour over a day from the newspaper, then place the data in their handheld calculator and examine it...
Curated OER
Public Land
Students examine the needs of their community for public space and determine the solutions to math problems related to planning landscape designs. They read and discuss an article from the New York Times, create their own designs for a...
Curated OER
Cartesian Coordinates
Students investigate rational numbers through data analysis and statistics. In this algebra instructional activity, students represent, rename, compare and order rational numbers. They collect and represent data correctly on a graph.
Curated OER
Probability and Expected Value
Students collect data and analyze it. In this statistics lesson, students make predictions using different outcomes of trials.
Curated OER
Finite Differences
Young mathematicians solve problems with polynomials. As they graph and analyze polynomial functions, learners define constant and finite, and determine the relationship between the constant set of differences and the slope of a linear...
Curated OER
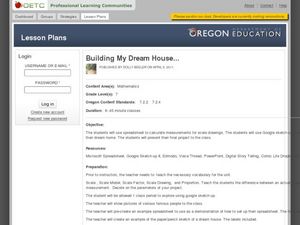
Building My Dream House
Students create their dream house using a spreadsheet for measurements. In this measurements and drawings lesson, students apply concepts of units and conversions as they build and create different shapes. They use Google Sketch-up to...
Curated OER
Divisibility Rules Using Scientific Calculators
Young learners apply divisibility rules to determine if a number is a factor of another number. They discuss what numbers are factors of another number and identify patterns using divisibility rules.
Texas Instruments
Getting Started with Cabri Jr.
Pupils construct geometric figures using Cabri Jr. in this constructing geometric figures using Cabri Jr. activity. They familiarize themselves with Cabri Jr. and construct segments and triangles. Your learners will use various tools to...
Curated OER
Fast Food Survey Using Bar Graphs
Second graders create a bar graph to pictorically represent the data collected from a survey of students. They use Excel to electronically create the graphs and data tallies. They then interpret their data using sentences to explain.


