Curated OER
Grade 1 Math Test
In this grade 1 math test worksheet, 1st graders complete a 30 question multiple choice quiz covering a variety of grade 1 concepts.
Curated OER
Hot n' Cold
Learners keep a weather log. In this weather and temperature lesson, students discuss the information that can be obtained from a map and lead into a discussion about temperature. Learners watch a video about temperature and...
Curated OER
A Plop and Fizz
Seventh graders perform an experiment to determine the effect of temperature on reaction rates. In this chemistry lesson, 7th graders take measurements and record data. They create a graph and analyze results.
Curated OER
High Mountain Retreat
Learners explore and analyze atmospheric conditions for a high mountain retreat. They examine the relationship between altitude, atmospheric pressure, temperature and humidity at a particular location. In addition, they write reports...
Curated OER
Download and Analyze
Students download information from a NASA website into a database. They transfer it to a spreadsheet by completing the information and analyze the information. They determine temperature averages, mode, and graph the results. They write...
Curated OER
Length Lotto-Teacher's Notes
Students convert metric units of length, specifically meters, centimeters, and millimeters. In this activity of converting measurements, students participate in various games which require them to put the measurements in order or...
Curated OER
Global Warming Statistics
Learners research and collect data regarding temperature changes for a specific location and find the mean, median, and mode for their data. In this climate change lesson plan, students choose a location to research and collect data...
Curated OER
How Long? How Wide? How Tall? How Deep?
Students estimate the length of given objects. For this measurement lesson, students explore the use of standardized measurement. They also approximate the measurement of given items. Students read stories about measurement and...
Curated OER
Metric Olympics
Students participate in a Metric Olympics event and use metric measurements to measure actual performances in their events. They throw a plastic straw for a javelin event, participate in a long jump and high jump event, and a variety of...
Curated OER
Mass: Applying and Interpreting
Students rotate through six studying stations solving problems that involve applying and interpreting aspects of mass. They solve various word problems, and measure the contents of cans and calculate the mass of two cans.
Curated OER
Fun With Adhesives
Students observe, measure, and record the properties in making objects stick together using science tools. In this science lesson, students explore with their senses while mixing flour and water. Additionally, students share their...
Curated OER
Let's Build a Worm Bin
Young scholars explore the process of decomposition. In this ecology and measurement lesson, students prepare a worm home to be used for vermicomposting. Young scholars weigh a group of worms and the added food, recording this...
Curated OER
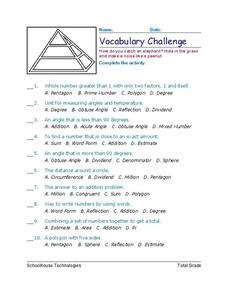
Vocabulary Challenge
In this math vocabulary learning exercise, students choose which multiple choice answer best defines twenty-five mathematical terms. Students place their answers on the lines provided.
Curated OER
Measurements
In this measurements worksheet, 5th graders practice reading measurements using a thermometer, ruler, and speedometer. Students find the temperature, length, and speed.
EdHelper
Temperature
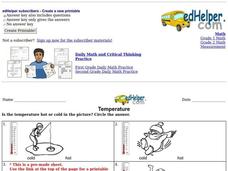
In this temperature learning exercise, students determine if the measurement of temperature is hot or cold in the picture using the illustrated images for help. Students circle the answers for the 7 problems.
Curated OER
States of Matter
Properties in measurement, pressure and viscosity of solids, liquids, and gases are the main topics covered in this slideshow. The explanations of Pascal's, Bernoulli's, and the Venturi effects are very clear. Easy to understand diagrams...
Curated OER
Calculator Activity: Temperature
In this calculator activity learning exercise, students learn to measure and find the temperature using a calculator. Students use the calculator to find the new temperature.
Curated OER
Geometry - Measurement
Students review the procedure for determining appropriate types of measurements for given situations and measurement conversions. They figure perimeter, area, and volume of 2 and 3 dimensional objects.
Curated OER
What's the temperature of the snow at different levels?
First graders measure the temperature of snow at different levels by participating in an experiment. They discover that snow is an insulator and use thermometers to find out the snow temperature. They record the temperature of snow on...
Curated OER
Temperature Conversion
In this online math worksheet, students practice converting between a variety of metric measurements. When complete, students submit their answers and get instant feedback regarding their accuracy.
Curated OER
Measuring Up on the Mayflower
Second graders use a meter tape to compare the length of the Mayflower to a basketball court and make homemade butter for crackers. Afterward, all students sit inside the makeshift Mayflower's dimensions and enjoy their Pilgrim butter.
Curated OER
Introduction to Measures of Central Tendency and Variability
Young scholars calculate the mean, median, mode, range, and interquartile range for a set of data. They create a box and whisker plot using paper, pencil and technology.
Curated OER
Data Analysis, Probability, and Discrete Math: Line Graphs
Eighth graders analyze data from line graphs. They discuss the purpose of line graphs, identify the parts of a line graph, answer questions about various graphs, and complete a worksheet. This lesson includes a script to teach along with.
University of Georgia
Using Freezing-Point Depression to Find Molecular Weight
Explore the mathematical relationship between a solvent and solute. Learners use technology to measure the cooling patterns of a solvent with varying concentrations of solute. Through an analysis of the data, pupils realize that the rate...


