Curated OER
Bubble Gum Chemistry
Students explore the concept of graphing data. In this graphing data instructional activity, students determine the percentage of sugar in bubble gum. Students graph type of gum vs. sugar percentage. Students create a table of their data.
Curated OER
The Quadratic Formula
Students solve quadratic function by completing the square. For this algebra lesson, students use the quadratic formula to factor quadratics and find the roots. They graph the parabola and identify its properties.
Curated OER
Tilted Squares and Right Triangles
Students investigate squares. They generate patterns from structured situations and find a rule for the general term and express it using words and symbols. Students generate patterns from a rule and substitute values and formulas.
Curated OER
Confusing Colors!
Fourth graders collect data, graph their data, and then make predictions based upon their findings. They's interest is maintained by the interesting way the data is collected. The data collection experiment is from the psychology work of...
Texas Education Agency
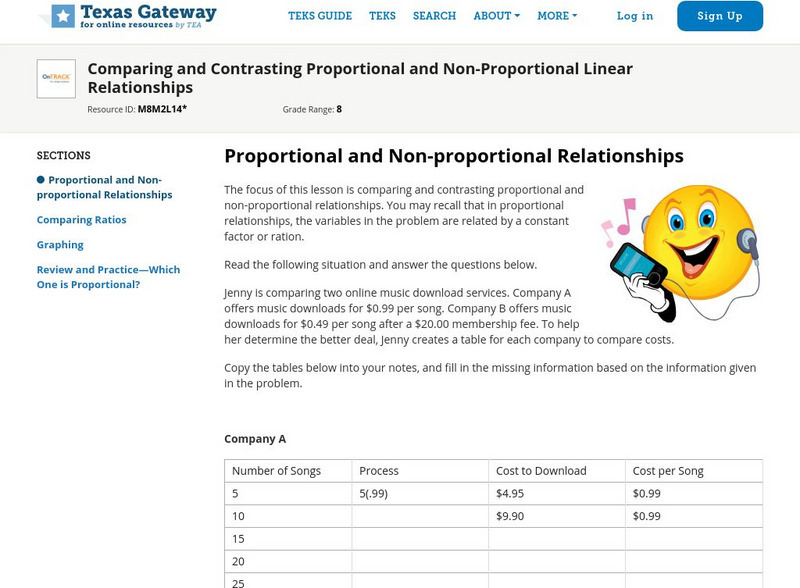
Texas Gateway: Proportional and Non Proportional Linear Relationships
Given problem solving situations, the student will solve the problems by comparing and contrasting proportional and non-proportional linear relationships.
University of Waterloo (Canada)
Univ. Of Waterloo: Wired Math: Linear Graphing: Graphing and Analyzing [Pdf]
The mathematics resource assesses students on linear relations. The activity has problems with graphing and analyzing linear relations. Some of the topics included are variation, scatter plots and linear relationships. The worksheet has...
Vision Learning
Visionlearning: Linear Equations in Science: Relationships With Two Variables
An introduction to the history of linear equations and how they relate to science.
PBS
Pbs: The Lowdown: Functional Relationships Between Quantities: Calculating Fuel Consumption
In these interactive visualizations, explore the relationship between calculating miles per gallon (mpg) to gallons per mile in fuel use for vehicles. Most drivers think gas usage falls linearly (in a straight line) as mpg increases. But...
Texas Instruments
Texas Instruments: Composing Music Mathematically
This activity is designed to motivate and challenge first year algebra students through a fun introduction to advanced mathematical concepts. It also offers extensions for upper grade level students. Students will recognize relationships...


![Univ. Of Waterloo: Wired Math: Linear Graphing: Graphing and Analyzing [Pdf] Unknown Type Univ. Of Waterloo: Wired Math: Linear Graphing: Graphing and Analyzing [Pdf] Unknown Type](https://d15y2dacu3jp90.cloudfront.net/images/attachment_defaults/resource/large/FPO-knovation.png)

