Curated OER
Water Layering and Circulation
Students examine relationships and interactions between different types of water. They experiment with colored water of different temperature and salinity and discuss how the results relate to real ocean currents.
Curated OER
Salt Water vs. Fresh Water
Middle schoolers explore why the oceans do not freeze. They explain why they think the Atlantic Ocean does not freeze. Students are given background information about what they are doing. They create a hypothesis about what they...
Curated OER
Combined Gas Law Practice Sheet
In this combined gas law worksheet, students use the temperature, the pressure and the volume of gases to find the unknown temperature, volume or pressure of gases using the combined gas law.
Polar Trec
Sea Ice Impact
The arctic seas contain currents that are both warm (with high salinity) and cold (relatively fresh water) that circulate throughout the year. Through discussion, a lab, and a web quest, participants explore the impacts of melting and...
Space Awareness
The Thermal Layers of Oceans
How much does the sun heat up a lake or ocean? Scholars use a cup and a strong lamp to investigate the heat transfer and thermal layers in the ocean to come up with the answer. They collect data and graph it in order to better understand...
NOAA
Technology I
Isn't technology great? The 12th installment of a 23-part NOAA Enrichment in Marine sciences and Oceanography (NEMO) program introduces technology that marine scientists use. Pupils take part in an activity using conductivity,...
NOAA
A Matter of Density
Larvae transportation on the New England seamounts is based on the density of the water. Scholars calculate density and graph salinity versus temperature to better understand the distribution of organisms in a water column. Discussions...
NOAA
Tracking a Drifter
Be shore to use this drifter resource. The third installment of a five-part series has learners using the NOAA's Adopt-a-Drifter website to track to movement of a drifter (buoy) in the ocean. Graphing the collected data on a map allows...
Curated OER
Hurricane Strength: Spatial Association of Wind Speed and Water Temperature
In this hurricane worksheet, students read and analyze satellite images of hurricane Rita. They complete 4 short answer questions about it.
NOAA
Ground-truthing Satellite Imagery with Drifting Buoy Data
Ground-truthing ... is it even a word? The last installment of a five-part series analyzes how scientists collect sea surface temperature data. Scholars use government websites to compare temperature data collected directly from buoys...
NOAA
History's Thermometers
How is sea coral like a thermometer? Part three of a six-part series from NOAA describes how oceanographers can use coral growth to estimate water temperature over time. Life science pupils manipulate data to determine the age of corals...
Chicago Botanic Garden
Albedo, Reflectivity, and Absorption
What is reflectivity, and what does it have to do with the Earth's climate? As reflectivity is measured by albedo, scientists can gather information on Earth's energy balances that relate to global warming or climate change. Budding...
NOAA
Fishy Deep-sea Designs!
Oceans represent more than 80 percent of all habitats, yet we know less about them than most other habitats on the planet. The instructor introduces the epipelagic, mesopelagic, bathypelagic, twilight, and midnight zones in the ocean....
Curated OER
Ocean Circulation
Students view and analyze buoy, satellite, temperature vs depth data to study about ocean circulation and how is related to atmospheric circulation. They read and interpret satellite image data related to: Surface wind speeds, Wave...
Curated OER
Oceanic Heat Budget Activities
Learners map and research imaginary islands located in different parts of the world. They describe the weather and climate of their island and show how local currents, water temperatures and waves may influence the weather patterns.
Curated OER
The Affect of Water Temperature on Living Organisms
Students examine the environmental impact of global warming. In this environmental science lesson, students design and conduct an experiment about the effect of temperature on paramecia. They write a lab report about their experiment.
Curated OER
Phytoplankton and Ocean Color
Fifth graders identify function of phytoplankton in the biospere by conducting experiments and simulations and reading for information. They detect the presence of phytoplankton in bodies of water by examining ocean in satellite images...
Curated OER
Temperature and Water Density
Students consider the effects of temperature on water density. In this Earth Science lesson, students evaluate a demonstration of cold and hot water currents in a model. Students use two liter bottles and varied water temperatures with...
Curated OER
Teacher's Guide For: Water Temperature and Salinity Experiment
Students experiment with water density, temperature and salinity. For this water lesson, students observe how the coldest water sinks to the bottom of a test tube, and how saltwater sinks in comparison to freshwater.
Curated OER
Sea Surface Temperature Trends of the Gulf Stream
Students explore the importance of the Gulf Stream. Using a NASA satellite images, they examine the sea surface temperature. Students collect the temperature at various locations and times. Using spreadsheet technology, they graph the...
Curated OER
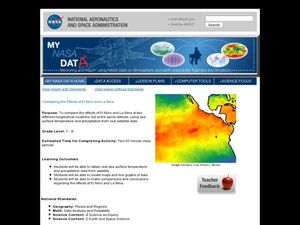
Comparing the Effects of El Nino and La Nina
Students examine the differences between an El Nino and La Nina year. For this investigative lesson students create maps and graphs of the data they obtained.
NOAA
I Didn’t Do It…Did I?: Make Your Own Greenhouse Effect
How do greenhouse gases affect the climate on Earth? Pupils explore the concept by first building their own apparatuses to model the greenhouse effect. Then, they record data to measure temperature change and determine that the amount...
NOAA
Deep-Sea Benthos
Much like a distant planet, the underwater world of deep-sea benthos is strange and largely unknown. How do creatures survive and thrive in such extreme pressure and temperature conditions? Young oceanographers join the crew of Operation...
NOAA
Energy from the Oceans
Can Earth's oceans produce a steady supply of clean energy? Scholars explore the uses of tidal and thermal energy in the 11th installment of a 13-part series about ocean-based alternative energy sources. Learners examine the current...


