NASA
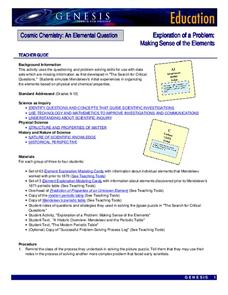
Exploration of a Problem: Making Sense of the Elements
When given too much data to simply memorize, it helps to sort it into manageable groups. The second lesson in the six-part series of Cosmic Chemistry challenges groups of pupils to take a large amount of data and figure out how to best...
Curated OER
Transformations and Matrices
There are four activities in this extensive lesson covering the identity matrix and scaling, the linear representation of translations, the linear representation of rotations, and reflections. In small groups, they use the Cabri II...
Curated OER
Operation Spaghetti
Find the math in recipes. Young chefs will follow a recipe and investigate the total cost for materials. They measure amounts of food necessary for the recipe and compute the per person cost.
Curated OER
Organizing Data
In this tally chart worksheet, students complete a tally chart of the number of each animal they see in the picture and answer short answer questions about it. Students complete the chart for 5 animals and answer 3 questions.
Missouri Department of Elementary
Ingredients of a Relationship Recipe
An eye-catching hook makes a smart analogy between ingredients for a food recipe and ingredients for quality relationships. Scholars discuss and list qualities they feel contribute to positive interactions. Pupils create a recipe card...
Curated OER
Representing Data
Students use their math skills to solve real-world situations. In groups, they must work with data and organize it in a chart for use to make different graphs. Individually, they complete different activities and share their results with...
Curated OER
Finding Equations
Students make equations from everyday data. They create a graph from the equations. Students predict and analyze the results. Students complete the second scenario on their own and turn in their handout.
Curated OER
Looking for More Clues
Fifth graders explore how to collect data and display it on a bar and circle graph.
Curated OER
Get Ready, Get Set, Get Organized! Lesson 2 of 2
Seventh graders examine the importance of being organized when making transitions. In this organization lesson, 7th graders watch a teacher demonstration of entering a room in a disorganized manner before discussing how the transition...
Curated OER
Give Me A Break!
Students create and conduct a survey. In this broken bones lesson, students discuss if they've ever broken a bone and how a broken bone heals. Students generate questions for a survey on broken bones and healing time, conduct the survey...
Curated OER
Violence On TV
Students examine violence on TV. In this data collection lesson, students explore TV violence. Students watch TV shows and fill out a checklist about the amount of violence. Students organize and analyze the information to make a report.
Curated OER
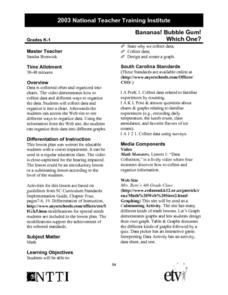
Bananas! Bubble Gum! Which One?
Students design and create a graph of data they have collected on their favorite candy bars. They explore how to organize data as well.
Curated OER
Favorite Survey
Fourth graders collect and organize data for charts and bar graphs by questioning their classmates. They utilize a worksheet imbedded in this plan which guides them through their 'favorites' survey.
Curated OER
It's Time for Testing Skills Rock!
Fourth graders take an inventory to assess their ability to utilize study and test taking skills. They receive the "Testing Skills Rock" song and start singing it. Students identify and underline the test taking skills mentioned in the...
Florida Department of Health
Mental and Emotional Health Education Unit
Stressed out? To begin a mental and emotional health unit, participants take a stress test to determine their level of stress. They study the effects of stress, identify sources of stress in their lives, and learn different ways to...
Shodor Education Foundation
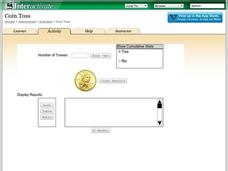
Coin Toss
Are your young mathematicians having a hard time making heads or tails of probabilities? It's no toss up—here is a resource that's sure to straighten them out! Learners run the interactive to toss a coin a different number of times....
101 Questions
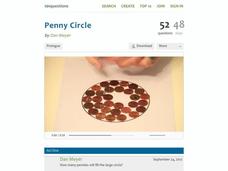
Penny Circle
Watch as your classes buy into a rich lesson full of information. A video opener challenges individuals to determine the number of pennies that fit in a circle with a 22-inch diameter. Using lesson materials, scholars collect data and...
Curated OER
Where Do I Fit on the Graph?
Students collect data and create graphs about themselves, their community, and the world around them. They use a variety of methods to organize data, such as stickers, clothespins, name tags, coloring, tally marks, etc.
Curated OER
Polluting the Environment
Fourth graders construct mini-ecosystem, pollute the ecosystem, observe, collect, and record data on the effects of these pollutants on their ecosystem, organize data on spreadsheets, create graphs, and design presentations to share with...
Curated OER
Lessons for Atlatl Users with Some Experience-Grade 6
Sixth graders experiment with an atlatl and dart. In this sixth grade data management mathematics instructional activity, 6th graders explore and determine the most suitable methods of displaying data collected from their...
Curated OER
Pythagorean Theorem Spreadsheet
Studetns use a spreadsheet to organize data on the sides of a triangle. They use the Pythagorean Theorem and the If then spreadsheet function to decide whether the three sides determine a right triangle. Middle schoolers work...
Pennsylvania Department of Education
Freckle Face
Students collect and record data. In this early data analysis lesson, students gather data about their partners face. As a class, the students use tally marks and pictographs to record the data and answer question about the information...
Curated OER
Paper Pool
Learners explore ratio and proportion, GCF, and LCM. In this middle school mathematics lesson, students play an interactive Paper Pool game that provides an opportunity to increase their understanding or ratio, proportion, GCF, and LCM....
Curated OER
Our Favorites
Students participate in and conduct a survey to determine various class favorites. They collect, organize and display their data, interpret the results, and complete a packet of worksheets to display the information.


