Curated OER
Lego Robot Competition
Students are introduced the "Lego Robot Competition", demonstrate Lego Data Control System that is controlled through tethers by laptop computers. High School students create the competition, organize the media coverage, and conduct the...
Curated OER
Use Proprotions To Solve Word Problems
Eighth graders explore ratios and proportions and how they are used in day to day life. As an activity, they find their own heart rate and then take a survey of other heart rates in the room. After organizing the data, 8th graders use...
Curated OER
Ethnic Folklore in Your Classroom: Traditions, Tales, and Treasures from Tijuana to Timbuktu
Students create their own festival. In this folk life lesson plan, students research their folklore history by interviewing their parents and grandparents, organizing the data found, and presenting that material to the class. Students...
Missouri Department of Elementary
Keep Finding the Positive
Group members take on roles to create a positive classroom community. Learners perform their role—leader, recorder, presenter, timekeeper, encourager, and collector—in preparation for a formal presentation of their positive thinking...
Missouri Department of Elementary
STAR Deputies, Unite!
STAR deputies unite! Scholars gather in small groups to solve problems using the STAR method. Pupils read a card that describes a situation that requires problem-solving. They role-play the scenario in front of their peers.
WindWise Education
How Does Energy Affect Wildlife?
Is wildlife affected the same way by different electricity generation methods? Teams work together to research four electricity generation sources and their impacts on wildlife. The teams create a summary report and share their findings.
Curated OER
Atlatl Lessons for Grade 4
Fourth graders explore the weapons of the Aboriginal people. In this fourth grade math lesson, 4th graders create charts, tables, or diagrams to represent patterns and relations. Students investigate which dart length has the best...
Curated OER
Plotting Coordinates on a Cartesian Plane
Students practice identifying points on a coordinate plane, creating charts, and calculating ratios. In groups, students play a "battleship" game where they determine the location of their own fleet and attempt to find the location of...
Curated OER
Waterfalls
Third graders practice identifying the main idea and supporting details when reading informational text. They read text related to waterfalls and practice note taking skills to identify critical details. Students use their notes to...
Curated OER
Garden in an Egg Carton
Students investigate the growth of seedlings planted in egg cartons in the classroom. Measurements are taken as the plants grow and charts created to organize the data.
Curated OER
Be A Bug Scout
Students perform outside activities to determine the amount of insects, flowers, or common weeds within an area. They predict the number of insects they will find within their square area. Using calculators, students organize the data...
Curated OER
If .... Then Probably
Students are introduced to the concepts of probability and chance. Using data given to them, they organize and create a chart to display the information. Using this chart, they calculate the percentage of chance and probability and...
Curated OER
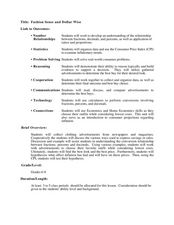
Fashion Sense and Dollar Wise
Students work in groups to show understanding of the relationship between fractions, decimals, percentages, and the application of ratios and proportions. In this decimals, fractions, and percents lesson, students use real life consumer...
Curated OER
Microclimates of Our School
Students read the story "Weslandia" by Paul Fleischman, define the term microclimate, gather and record data in various places on school grounds to establish the presence of difference microclimates, analyze and compare microclimates,...
Curated OER
Radiation and Color
Tenth graders explore the relationship between color and heat absorption by measuring the temperature change of water in differently colored test tubes as they are exposed to a heat lamp. They work in small groups to collect data and...
Curated OER
A Day to Remember!
Students study math. In this real-life problem solving lesson plan, students work on their skills dealing with time and money. They work in small groups on various time and money word problems and by the final day they have a final...
Curated OER
Paint Property Experiments
Students identify various kinds of paints by using the scientific method. In this solvents lesson students collect data and identify paint samples while working in teams.
Curated OER
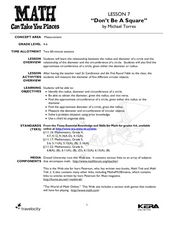
Don't Be a Square
Students analyze the relationship between radius and diameter. Students read Sir Cumference and the First Round Table then take measurements of circular items from around the room. Students compute the radius, diameter and...
Curated OER
CSI Rhino
High schoolers study the rhinoceros and how the species has survived for so long. For this rhino lesson students create graphs and research what is being done to protect the rhino.
Shodor Education Foundation
Graphing and the Coordinate Plane
Ready to introduce your class to the coordinate plane? This website includes a detailed lesson plan that includes two interactive games to help learners practice graphing ordered pairs. The scripted discussion is a little cheesy and a...
Curated OER
Rename Fruits, Vegetables and Spices
Students explore fruits and vegetables. In this fruits and vegetables lesson plan, students study traits of various fruits, vegetables and seeds. Students rename fruits, vegetables and seeds.
Curated OER
Weather In The World
Students investigate the weather in different places in the world. In this algebra lesson, students use technology to gain an understanding of how to study integers. They add and subtract integers on a number line.
Curated OER
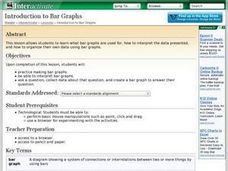
Introduction to Bar Graphs Lesson Plan
Students organize and interpret data using bar graphs.
Curated OER
You mean college costs that much?
Seventh graders collect, organize, and analyze data as they research colleges on the Internet. They graph their collected data on a line graph and use a spreadsheet on Microsoft Excel in order to organize the data.


