Curated OER
Virtual Field Trip
Learners calculate gasoline cost per mile on a virtual field trip. They calculate the gasoline costs and travel time for each of the 2 routes, and record on a data sheet. They use Excel to create data tables for mileage, gasoline...
Curated OER
Air in Soil Administration Procedures
Students study soil and its composition. In this soil composition lesson, students study examples of soil during several days of aeration. Students summarize their data, organize it, and must be able to explain their findings.
Curated OER
Graphing Favorite Colors
Third graders collect data and insert it into ClarisWorks to create a spreadsheet/graph of their favorite color. They interpret the data together.
Curated OER
Comparing Weather Conditions
Students conduct research on temperature, wind speed and weather conditions from a variety of areas. They organize their findings on worksheets and spreadsheets and discuss various examples of databases.
Curated OER
Different Perspectives of Oregon's Forest Economic Geography
Students locate the many forests located in Oregon. In groups, they use the internet to research employment data on wood products made in the state. They discuss how looking at information presented in a different way can change their...
Curated OER
Graphing Grazy Crayons
Children create crazy crayons they made to sort and construct a floor bar graph. Then, using technology resources, they make a simple bar graph to compare the top four colors produced. Students will then interpret the printed graph by...
Curated OER
Plot! Analyze! Draw your Conclusions!
Students download data reported from the Global Sun Temperature Project website. They graph and analyze the data looking for trends and patterns. They prepare a class report with their observations and post it to the website.
Curated OER
Just Graph It!
Students research presidential election voting results, and organize and interpret data on class graphs.
Curated OER
So -- What's Happening Here? On this Old Christmas Tree Farm
Young scholars take a field trip to an old Christmas tree farm near their school. In groups, they gather data at the site and analyze the data in an attempt to discover what happened to the area. They identify human activities that led...
Curated OER
The Changing Face of Science
Students are introduced to the ways women have changed the fields of Science and Math. Using the internet, they research women's contributions to these two fields and take notes on the information they find. They organize their data...
Curated OER
Paper Pool
Students analyze the measurements of rectangles. In this analysis activity, students will investigate patterns by looking at ratios. Students will also hypothesize the probability of a ball going into a certain pocket when playing pool....
Curated OER
Survey Say...
Students examine a variety of charts and graphs that present data in a format that is easy to read. They work in groups to conduct a survey amongst their classmates. The data collected from the survey is then put on a bar graph.
Curated OER
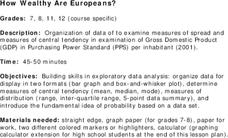
How Wealthy Are Europeans?
Students investigate measures of central tendency. They examine compiled data and conduct critical analysis. The graph is focusing on the gross domestic product data. The lesson also reviews the concept of putting values in order of...
Curated OER
Hazard Alert
Students examine data regarding the occurrence of natural hazards as they occur in the United States. They record data on a classroom chart, map the areas affected by the hazards, and analyze and discuss conclusions drawn from the...
Curated OER
What is a Cloud
Third graders study clouds and how they are formed. They write acrostic poems about clouds and analyze and graph temperature data collected during varying degrees of cloud cover.
Curated OER
For the Record: Black Inventors and Inventions
Young scholars create a database with the inventions of African-Americans. They analyze and sort the data in an appropriate fashion. They use the internet to gather their information for the database.
Curated OER
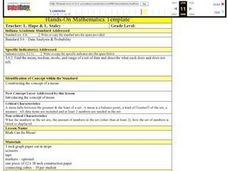
Math Can Be Mean!
Fifth graders are introduced to the topic of means. Calculating the mean, mode and median, they describe what each set of numbers tell and do not tell about the data. They use a line graph to practice finding the mean. They also use...
Curated OER
Spreadsheets - WP9/Quattro Pro
Students discover spreadsheet applications using Quattro Pro. They demonstrate basic knowledge and application of hardware, software, and Internet use. They recognize and appreciate the value of recording keeping, data input and data...
Curated OER
Scientific Inquiry: Periodic Motion
Students construct their own pendulum. In this physics activity, students design an experiment to find the factors affecting its period. They formulate a conclusion based on experimental data.
Curated OER
Late Bloomers
Pupils demonstrate an understanding that individuals grow at various rates. In this health instructional activity, students read Leo, the Late Bloomer and identify ways to be tolerant of others. Pupils record the height of classmates and...
Curated OER
Tooling Around Arizona: Reading Arizona Maps
Students research Arizona maps. In this map lesson, students discuss map titles, scales, directions, elevation, and symbols. The class will examine topography, landforms, and rivers found on an Arizona map.
Ohio Department of Education
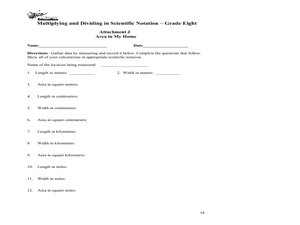
Multiplying and Dividing in Scientific Notation - Grade 8
Here is really nice set of resources on scientific notation. Eighth and ninth graders explore the concept of multiplying and dividing in scientific notation. In this multiplying and dividing numbers in scientific notation instructional...
Curated OER
The School Holiday Calendar
Various Muslim holidays and their meanings are researched and your students will predict whether or not they should be recognized on the New York City school calendar. An extension could be to write a letter to the Mayor about their...


