Statistics Education Web
Text Messaging is Time Consuming! What Gives?
The more you text, the less you study. Have classes test this hypothesis or another question related to text messages. Using real data, learners use technology to create a scatter plot and calculate a regression line. They create a dot...
Statistics Education Web
Consuming Cola
Caffeine affects your heart rate — or does it? Learners study experimental design while conducting their own experiment. They collect heart rate data after drinking a caffeinated beverage, create a box plot, and draw conclusions. They...
Kenan Fellows
Effects of a Golf Course on Stream Health
Is the golf course causing issues in the stream? Find out with a resource that has groups perform chemical water tests to analyze the effects of a golf course on a stream. Pupils collect water above and below the course and analyze the...
EngageNY
Vectors and the Equation of a Line
Represent linear equations in both two and three dimensions using parametric equations. Learners write parametric equations for linear equations in both two and three variables. They graph and convert the parametric equations to...
NOAA
Biological Oceanographic Investigations – Signals from the Deep
The Deepwater Horizon oil spill directly impacted an area of the Gulf of Mexico the size of Oklahoma. A marine biology instructional activity looks at the impact of an oil spill on the deeper parts of the ocean. Scholars download actual...
Colorado State University
If You Can't Predict the Weather, How Can You Predict the Climate?
Why is the weather man wrong so often? Young climatologists discover how chaos rules both weather and climate through a math-based activity. Using an iterative equation, the class examines how small day-to-day weather events total up to...
Workforce Solutions
Plan a Vacation
Challenge scholars to plan a vacation with a $5,000 budget. Learners review costs of transportation, meals, and entertainment while considering the number of people and destination. Worksheets provide information and well-organized...
Shodor Education Foundation
Racing Game with One Die
Pupils roll a die to figure out which car advances on a race track. They determine the rules for each car moving forward and, given the statistics of the winner, compare if it matches their predictions.
Shodor Education Foundation
Crazy Choices Game
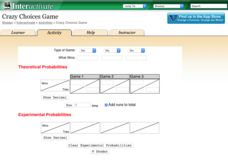
Wanna take a chance on which game is best? The resource provides three games of chance using multiple types of games. Games range from coin toss to cards. Choosing a type of game, pupils determine what wins and enter the theoretical...
Shodor Education Foundation
Spinner
Go round and round to compare theoretical and experimental probabilities. Learners set the number of sectors and the number of spins for a spinner. Then, a table displays the experimental and theoretical probabilities of the spinner for...
Shodor Education Foundation
Marbles
Grab some marbles from a bag. The applet simulates drawing marbles from a bag. Pupils determine the number of four colors of marbles in a bag and how many marbles to draw. Using information on whether order matters in the draw and if...
Shodor Education Foundation
Plop It!
Build upon and stack up data to get the complete picture. Using the applet, pupils build bar graphs. As the bar graph builds, the interactive graphically displays the mean, median, and mode. Learners finish by exploring the changes in...
Shodor Education Foundation
Measures
Take a look at data from a statistical lens. An interactive allows pupils to enter data set, labeling the data including the units used. Manipulating the applet, learners select the statistics to calculate that include total, mean,...
Curated OER
Galaxy Hunter - A Cosmic Photo Safari
Space science stars journey through our night sky and take virtual photos of galaxies to investigate simple random samples. Higher math is used to analyze the data collected. Copy the evaluation/assessment questions onto a handout for...
Curated OER
Trends of Snow Cover and Temperature in Alaska
Students gather historical snow cover and temperature data from the MY NASA DATA Web site. They compare this data to data gathered using ground measurements from the ALISON Web site for Shageluk Lake. They graph both sets of data and...
Curated OER
An Electronic Self-Portrait Lesson Plan - A Unit for Middle School
Using a photo of themselves for inspiration, learners create a multi-media self-portrait. A digital image of each child is taken, it is uploaded into the computer where is can be experimented with in a digital format. Young artists then...
Curated OER
Stone Soup
Students examine the topics of conflict, resolution, and solution using the book "Stone Soup." They create a class pictograph using real vegetables brought in by the students, answer story comprehension questions, and sequence the events...
Curated OER
Name That Tune
Integrating technology and music can be a snap with lessons like this one! Kids in a junior high band class took to the Internet to download and practice playing their instrument with a computer generated back up band. They practice...
Discovery Education
Discovering Math: Exploring Geometry
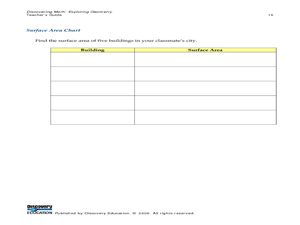
Apply geometric properties and formulae for surface area and volume by constructing a three-dimensional model of a city. Learners use similar and congruent figures and transformations to create a city of at least 10 buildings. They trade...
J. Paul Getty Trust
Shaping Ideas: Symbolism in Sculpture—Lesson 2
Young artists create a series of sketches of ideas for a sculpture, and using the criteria develop in the previous class, critique their sketches. They then choose one of their ideas and create their work of art.
Curated OER
Latch Circuits
In this circuit activity learners complete a series of short answer questions using circuit diagrams to show the input and output of different switches.
Curated OER
Forest Fires
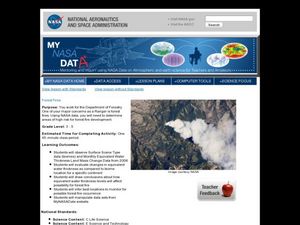
Young scholars play the role of a Ranger with the Department of Forestry. For this forest fires lesson, students examine data on biomes and images to determine high risk areas for forest fires to develop.
Curated OER
Creating Climographs
Students use satellite data to compare precipitation and surface temperatures on different islands. In this satellite lesson students create graphs and explain the differences between weather and climate.
Curated OER
Differences Between Ground and Air Temperatures
Students examine the differences between air temperature and ground temperature. In this investigative instructional activity students find NASA data on the Internet and use it to create a graph.


