Curated OER
The Interactive Periodic Table of the Elements
Students study the different types of metals. In this investigative lesson students watch a demonstration on the effects of temperature on atoms and take a tour through baone matter.
Curated OER
Energy Defined
Fourth graders complete activities to study the sources of energy and forms. In this energy lesson, 4th graders discuss the origin of energy and define it. Students participate in several experiments to further study energy including a...
Curated OER
History Theory of Evolution
Students identify fossils. They identify evidence of change over time when given pictures of fossils to determine the proper sequencing. In addition, they determine evolutionary relationships by comparing embryonic structures.
Curated OER
Melting Ice is Hot Stuff!
Fourth graders determine the amount of energy required to melt ice using a calorimeter. They calculate the Molar Heat of Fusion of Ice.
Curated OER
Which Brand of Air Freshener is Most Cost Effective?
Students use scientific method to determine cost-effectiveness of air freshener, and create PowerPoint presentations to share their results.
Curated OER
Rock On!
Fourth graders make models of igneous, metamorphic, and sedimentary rocks out of different types of candy and cookies.
Curated OER
Heating Curve Lab
Tenth graders examine the heating curve of water when head is added constantly over time. They input values into a calculator as they record water temperature every thirty seconds as it is heated on a hot plate. They complete the...
Curated OER
The Effects of Temperature on Solids
Young scholars explore the effects that extreme temperatures have on the material properties of solids. They investigate the properties of a material whose state depends on extreme temperatures and witness how it interacts with room...
NorthEast Ohio Geoscience Education Outreach
Density and Pressure of a Hot Air Balloon
Using a dry cleaner bag and a blow dryer, create a hot air balloon! The materials list suggests obtaining one dry cleaner bag per student, but since this is probably inconvenient, consider doing this as a demonstration during a lesson on...
Curated OER
Skyscraper Capers
Young scholars discuss skyscrapers and listen as the teacher introduces the project. They use the Internet to perform research on one skyscraper. Students use information they gather to create a brochure of their building . They create...
Curated OER
Water Cycle
Students investigate, develop inferences, and differentiate between different elements of the water cycle. They investigate the observable characteristics of evaporation and condensation over specific time periods
Other
Science4 Us: Changes in Matter
Through an instructional video, games, and activities, students explore three types of change matter makes: physical change, in which only the shape of the matter changes; physical phase change in which matter changes to a different form...
OpenStax
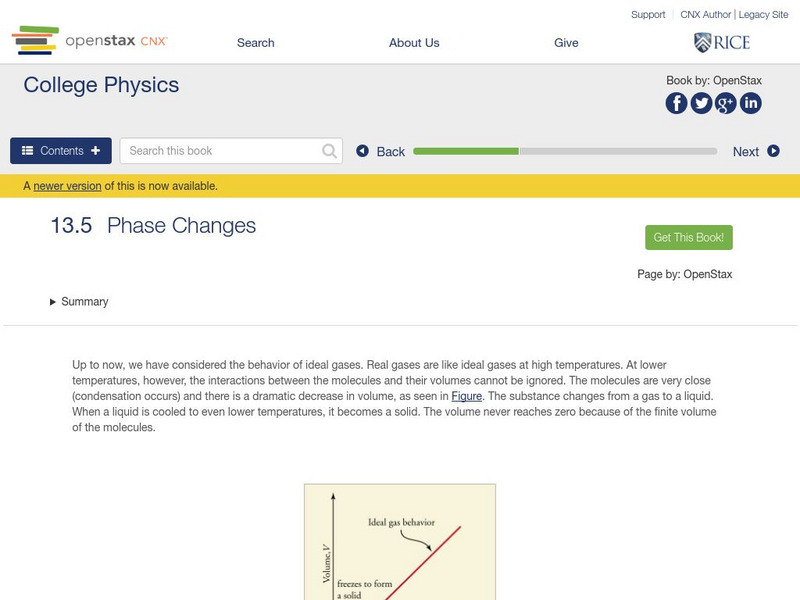
Open Stax: College Physics: Phase Changes
Learn about the phases of matter in this section of a college textbook. Section defines the phases of matter and discusses how to interpret a phase diagram. Also explored is partial pressures and Dalton's Law. Section also includes...
Texas Instruments
Texas Instruments: Who Says a Watched Pot Never Boils?
In this activity, students' will investigate what causes phase changes in matter.They use a temperature sensor to measure the temperature of a substance and identify visual clues to the phase changes.
University of Colorado
University of Colorado: Ph Et Interactive Simulations: States of Matter
Watch different types of molecules form a solid, liquid, or gas. Add or remove heat and watch the phase change. Change the temperature or volume of a container and see a pressure-temperature diagram respond in real time. Relate the...
Concord Consortium
Concord Consortium: Stem Resources: States of Matter
Using simulations observe what solids, liquids, and gases look like at the atomic scale. After observing the different states of matter at their atomic level, students will be able to conclude about the forces and attractions that exist...
Chem Tutor
Chem Tutor: Chemistry: States of Matter
This lesson focuses on the states of matter: solids, liquids, and gases. It also discusses the Kinetic Theory of Matter, Thermodynamics, Triple point, Phase Change Graphs and the Heating Curve of Water. It provideds adrawing of a heating...
Science Education Resource Center at Carleton College
Serc: Exploring States of Matter Gases
In this series of chemistry labs, students learn about the three states of matter by observing how molecules contract or expand as they change state.
University Corporation for Atmospheric Research
Ucar: Just a Phase: Water as a Solid, Liquid, and Gas
This site helps students construct a model of the arrangement of water molecules when present as solid, liquid or gas. Includes background information, lesson plans, links to standards and assessment ideas.
New York University
New York University: What Is Matter?
At this resource discover the difference between solids, liquids, and gases. Practice what you just learned with included review questions.
Florida State University
Florida State University: Intermolecular Forces: Changes of State
Discusses the changes of state that can occur for the three different types of matter (solids, liquids, and gases) and different types of heat energy that have been defined by scientists.
Quia
Quia: Phases of Matter
Four activities for reviewing vocabulary and definitions related to changes in states of matter.
CK-12 Foundation
Ck 12: Classification of Matter
[Free Registration/Login may be required to access all resource tools.] In this online tutorial students will define a mixture and understand why mixtures are different than pure substances. They will classify mixtures as homogeneous or...
Purdue University
Purdue Univ: Gases, Liquids, and Solids
This site has a brief description of the differences in particles in a gas, liquid, and solid. Animated microscopic pictures demonstrate the molecular movement in each state. Information is then summarized in an easy-to-read chart.


