Curated OER
Woodland Math Facts
In this Woodland math facts activity, students study and examine woodland weights of trees and shrubs, explore invertebrates and draw a bar chart to chart their findings.
Curated OER
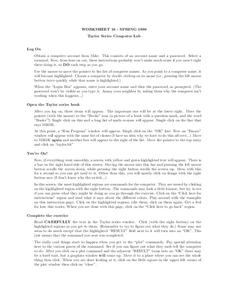
Worksheet 16 - Spring 1996
In this math worksheet, students read the instructions for setting up a computer program. Then they practice graphing the functions with the software program.
Curated OER
Numerical Analysis: Analyzing Root Finding Algorithms
In this root finding worksheet, students compare graphs and shade in regions corresponding to given convergence criteria. They compute the solution of equations of one variable. This two-page worksheet contains six problems.
Curated OER
Button Sort
In this sorting activity worksheet, students sort 12 pictures of different buttons by an attribute that is determined by the teacher. They sort the buttons on the chart using a variety of sorting attributes.
Curated OER
Problem Solving: Steps and Strategies
Young scholars explore the concept of problem solving strategies. For this problem solving strategies lesson, students discuss methods for solving problems such as re-reading a problem, stating the facts, drawing a picture and so on....
Curated OER
Solids and Liquids
Students complete activities to study the properties of solids and liquids. In this states of matter lesson, students investigate the melting and freezing of a range of materials in a virtual experiment. Students melt the substances and...
Curated OER
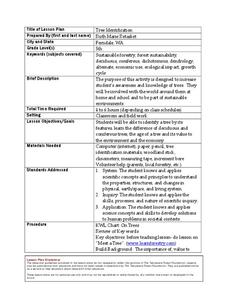
Tree Identification
Students list four ways to identify trees. In this tree identification instructional activity, students use tree identification techniques such as leafs, bark, wood grain, soil type, and climate to create tables and graphs.
Curated OER
Symmetry in Kaleidoscope Designs
Students define reflection, rotation and symmetry. In this symmetry lesson, students move the graph around the coordinate plane and identify the line of symmetry. They identify the different designs of a kaleidoscope.
Curated OER
Venn Diagram
Young scholars classify items and numbers by using a Venn diagram. In this Venn diagram lesson plan, students use the computer to do this and classify pictures and numbers.
Curated OER
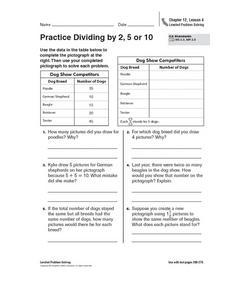
Practice Dividing by 2, 5, or 10
In this pictograph problem solving worksheet, students analyze the data on a table and create a pictograph. Students read and solve 6 story problems about the pictograph.
Curated OER
Equal Parts
In this equal parts worksheet, students, working with a partner, study, formulate and calculate the answers to six word problems or drawings.
Curated OER
Problem Solving: Use a Table Reteach 16.8
In this problem solving worksheet, students learn to look for information in a data table. Students answer 6 questions about a data table.
Curated OER
Range, Mean, Median, Mode
Students research the impact of craters. In this range, mean, median and mode lesson, students complete an experiment with a marble to simulate the effects of a crater. Students collect and analyze data finding the range, mean, median...
EngageNY
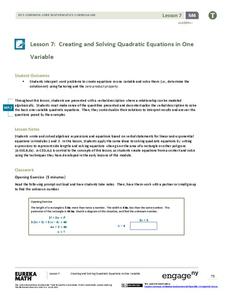
Creating and Solving Quadratic Equations in One Variable
Give your classes practice at modeling using quadratic models with a resource that uses area and integer problems to allow individuals to create second degree polynomials. Young mathematicians solve equations using factoring and then...
Space Awareness
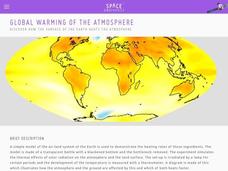
Global Warming of the Atmosphere
Scientists know the amount of carbon dioxide in the atmosphere today is higher than at any point in the last 800,000 years. Scholars learn about the amount of thermic radiation absorbed by air and what happens to the rest of the...
Curated OER
Visual Literacy: Using Images to Increase Comprehension
A colorful PowerPoint is a great way to introduce the topic of visual literacy. The eye-catching presentation begins with an overview of visual literacy and then provides some specific strategies to help enhance reading comprehension. As...
Livaudais-Baker English Classroom
Kindred Unit Project
To conclude a unit study of Octavia E. Butler's Kindred, groups use MovieMaker or the class website to publish an original story about slavery in America. The detailed project assignment sheet includes a list of possible topics,...
Curated OER
Tally Time
Students create a tally chart. In this math and health instructional activity, students discuss healthy foods and create a tally chart showing the number of students who like to eat healthy foods.
Curated OER
Survey Surfing
Students survey other students and record the information on a chart using tally marks. They record their favorite fish and their favorite foods, and share the results with the class.
Curated OER
A Christmas Place
In this graphing worksheet, learners plot the points on the graph to create a picture of a Christmas tree. Students plot 37 points and connect them where told to.
Curated OER
LIONS and TIGERS and BEARS. . .Oh My! Animals of Connecticut and the World
Students identify and list the different types of pets owned by the children in the class.
They graph the total number of each type of pet owned. They draw or cut-out a picture of an animal. Using the materials listed above, the children...
Curated OER
Routines and habits
Students tell time to the hour, half hour and quarter hour. They practice vocabulary of daily routines. They match word cards with a picture representation of the card. They graph classmates schedules.
Curated OER
Worksheet 22 - Spring 1996
students examine the potential of creating the involute for a circle. They use the concept to create new parametric equations. They graph the picture for each.
Curated OER
Worksheet 19
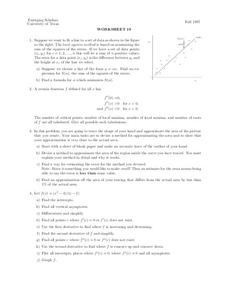
In this math instructional activity, students try to fit a line to a set of data. Then they use the least squares method is based on minimizing the sum of the squares of the errors.
Other popular searches
- Coordinate Picture Graphs
- Christmas Picture Graphs
- M&m Picture Graphs
- Hidden Picture Math Graphs
- Picture Graphs Worksheets
- Math Lessons Picture Graphs
- 5th Grade Picture Graphs
- Bar and Picture Graphs
- Thanksgiving Picture Graphs
- Circle and Picture Graphs
- Picture Graphs Template
- Reading Picture Graphs


