Curated OER
Where We Live
Learners become aware of the different homes in which people may live. They create a simple bar graph to compare the dwellings of their classmates. Students draw pictures of their own home and describe the details of the home to be...
Curated OER
Down by the Bay
Students listen to teacher read books about fish and participate in activities in order to explore how to identify bluefish. They count and graph the numbers of fish they find in simulated fishing activities.
Curated OER
Tracks are for Trains
Second graders collect data on different forms of transportation and create a bar graph or pictograph with the information.
Curated OER
Technology: Programming Graphics
Students use the DrScheme program to create graphics for clip art. Using graphics, they plan their designs using basic shapes, plotting its positions, and studying the relationships between points. By plotting the necessary data on...
Curated OER
Sports in Physics: Measuring Velocity in a Mini-Olympics
Eighth graders examine the difference between speed, velocity and acceleration. In this velocity lesson students read and construct a line graph and a bar graph to show information about velocities of sports activities.
Curated OER
It Takes All Kinds!
Students view video clips and observe similarities and differences between animals. They sort animals into groups for a zoo. They make a graph of their observations and review scientific classifications.
Curated OER
Sunspots and Climate
High schoolers make a graph that shows how the number of sunspots has changed over the past 30 years and discover how there is a pattern in sunspot number. They find a disruption in this pattern due to the Little Ice Age.
Curated OER
Prom Date
Students use the internet to research the cost of going to the school prom. As a class, they brainstorm about the things needed in order to go to the dance and use advertisements to make a budget. After all of the data is collected,...
Curated OER
Who Built It?
Seventh graders study the difference between architectural detail from the Romanesque and Gothic eras. The class participates in discussion on are in different eras. They predict what picture belongs in what era.
Curated OER
Animals That Fly or Do Not Fly
Students create a chart and classify animals according to if they can or cannot fly. They find and cut out pictures of the animals and glue them in the correct place on the chart.
Curated OER
Track's Slippery Slope
Middle schoolers graph data of sports figure running time using x-axis y-axis to find slope of trend line, mathematically find the interpolated and extrapolated values for data points. Using the information they make predictions.
Curated OER
How Much Water Do We Use In Our Homes?
Learners discover the amount of water used for everyday activities around their home in this lesson. They research the amount of water needed by accessing a provided internet link. They then graph the information they discovered and...
Curated OER
MT-A141 PreCalculus: Worksheet 6.2/6.3
In this precalculus worksheet, students use their graphing calculator to determine the coordinates for given functions. They determine the values for cosine, sign, tangent, and secant of given equations. Given an angle of elevation,...
Curated OER
Exploring the Uses of Beaks
Students explore the uses of bird beaks in the wild by participating in experiment stations. In this bird adaptation lesson, students work in groups and complete experiment stations that represent different types of bird beaks. Students...
Curated OER
How's the Weather
"How's the Weather?" is an exercise that combines science and math as pupils graph the weather along the Iditarod Trail. They complete a double-line graph of the weather of a chosen checkpoint over the course of one week. Students graph...
Curated OER
Mapping an Artifact
Young scholars copy a present day artifact onto graph paper. In groups, they decide the scale of the drawing and create the picture using specific graphing points. They are also given photographs in which there are no graphing points and...
Curated OER
Chart Trivia
Learners practice addition and subtraction problems and answer questions using greater than and less than. They chart information to create a graph on the computer.
Curated OER
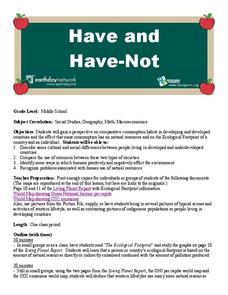
Environment: The Haves and the Have Nots
Students examine consumption habits in developed and developing countries and determine their effects on natural resources. In groups, they assess graphs on the Living Planet Report and observe the connection between consumption and...
Curated OER
Math And Reading
In this math and Language Arts worksheet, learners mark the vowel sound they hear for each picture and write a sentence about a picture. Students also use a graph to answer three questions.
Curated OER
Hare and Lynx Population
Fourth graders study changes in animal population. In this graphing lesson, 4th graders create graphs from information read to them about hares and lynx populations. They will describe patterns of change in the graphs and discuss why...
Curated OER
Turkeys or Eagles?
Students discuss how Benjamin Franklin wanted the wild turkey (not the bald eagle) to be our national bird and then graph their preferences and discuss the survey results.
Curated OER
Missed The Boat
Students complete time and distance problems. Using appropriate problem solving strategies, students determine when a helicopter will catch a cruise ship. Students write a summary of their solution process. They complete a graph to...
Curated OER
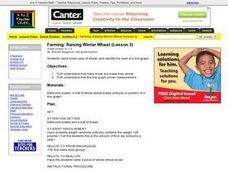
Farming: Raising Winter Wheat (Lesson 3)
Students identify foods that are made from wheat. They use a line graph to explain measurement. They identify foods from the food groups and explain how temperature, prefcipitation and natural resources affect the growth of wheat.
Curated OER
Celebrate You
First graders locate place of birth on a map. They identify their birthdays and place a graphing square with their birthday written on it under the corresponding month. They compare birthdays on the graph. They read "P.B. Bear's Birthday...
Other popular searches
- Coordinate Picture Graphs
- Christmas Picture Graphs
- M&m Picture Graphs
- Hidden Picture Math Graphs
- Picture Graphs Worksheets
- Math Lessons Picture Graphs
- 5th Grade Picture Graphs
- Bar and Picture Graphs
- Thanksgiving Picture Graphs
- Circle and Picture Graphs
- Picture Graphs Template
- Reading Picture Graphs


