Curated OER
How Much Will This Cost?
Young scholars determine how much money is needed for a service learning project. They create a graph or chart to explain the budget for the service project. They complete budget worksheets as their plan goes into action.
Curated OER
All of Me
Students draw pictures showing some of the different aspects of their lives, and share the pictures with classmates.
Curated OER
Civil War Time Line
Pupils draw a time line on graph paper on a scale of one square to every five years beginning in 1770 and ending at 2000. They place historic events and inventions in their correct time period on the time line, and add their birthday to it.
Curated OER
Time, Tide, and Quahogs
Students read tide tables for Waquoit Bay as the simulate determining the best time to go clam digging for a Wampanoag clambake. They graph the tide tables while realizing that the tides a Waquoit Bay are one hour later than those at...
Curated OER
Water and Land 207
Students examine maps of different projections, mathematically calculate distortions, and note the advantages and disadvantages of each map. They study the different maps and transfer the map to graph paper.
Curated OER
Learning to use and understand a database
Second graders were given a research paper and they were to answer the questions using the information found on the website. The website was a dictionary where the students would click on the letter to where they would go to find the...
Curated OER
Give It Back From a Snack Lesson 2: Invest With the Best
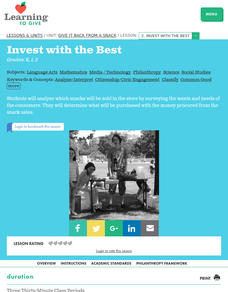
Students survey schoolmate as to what type of snacks they would prefer to purchase. They graph the results and apply them to planning a classroom snack sale while examining what wants, needs, and consumers are.
Curated OER
Research Project
Learners poll the class regarding their favorite pet and then research that pet using Internet research. They create reports including pictures made on KidPix.
Curated OER
Mobile of Information
Young scholars create a mobile of various geometric designs to be usend to display information from a variety of texts. They add graphics as well as graphs and charts, color, design and artwork to express the ideas learned through the...
Curated OER
Styles Of Seminole Clothing
Students participate in demonstrations from guest speakers, community members and teacher-lead discussions, tell differences and similarities between contemporary and traditional styles of Seminole clothing, explain the different designs...
Curated OER
What is an Explorer
Students become explorers. They examine a picture of an explorer and create props to explore within the classroom. Students are studying the Louisiana Purchase of 1803. They explore how to read a map and create a map of the classroom...
Curated OER
Constellations
In this constellations instructional activity, students write their name as a constellation using an x and y-axis graph. This instructional activity has 1 graph to create.
Curated OER
Geometric Figures
Students identify two and three dimensional shapes and use appropriate geometric vocabulary to write a description of the figure by taking pictures of geometric figures in their own environment.
Curated OER
What is a Tropical Rainforest?
Students investigate amounts of rainfall in selected world rainforests by creating a bar graph showing rainfall in inches for each. They convert inches to millimeters, and solve word problems having to do with rainfall in selected world...
Curated OER
Applemania
First graders read "Ten Apples Up On Top!" and view real apples in a basket. They taste different kinds of apples and describe the tastes: sour, sweet, etc. They graph everyone's favorite apple. They interpret the graph and draw their...
Curated OER
Introduction to the Oscilloscope as a Voltmeter
Students measure the electric potential of 9 volt batteries using oscilloscopes. They draw a diagram of the front panel of the oscilloscope, conduct the experiment, and create a graph of voltage versus the number of batteries.
Curated OER
Investigating Motion
Students determine velocity using the slope of a time distance graph. They investigate a motion cart using a CBR unit and a TI 83 calculator setup. Using the graph generated, they calculate velocity.
Curated OER
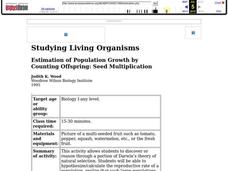
Estimation of Population Growth By Counting Offspring: Seed Multiplication
Students calculate the reproductive rate of a plant that creates multi seed fruits. They graph exponential growth and the complete a series of questions that help them infer that natural selection processes are at work in this population.
Curated OER
Inventors Unit Survey
Students develop and conduct a survey for their inventors unit. They create a five question survey and tally the survey results, and create a graph using Microsoft Word and Graph Club 2.0.
Curated OER
Pepe Cleaners
Seventh graders gather data to determine the relationships between the base and height of rectangles with fixed perimeters and express the relationships using words and symbols. Students build rectangles with pipe cleaners. They create...
Curated OER
Growing Tomatoes
Second graders investigate the growth of tomatoes. They plant grape tomatoes and observe them. They write in a journal and take digital pictures of their tomato plants. They create bar graphs to tally the progress of their plants and...
Curated OER
Learning to be a Super Speedy Reader
Learners review the steps to follow when they come to a word that they do not know, review blending, and the body and coda part of the word. They time the teacher as she reads for one minute using the clock on the wall. They then read...
Curated OER
"Ball Bounce" Quadratic Functions
Young scholars manipulate a ball and explore quadratic functions. In this algebra instructional activity, students analyze the graph of a quadratic function. They identify quadratic properties.
Curated OER
Monkey Mayhem
In this sorting and categorizing instructional activity, students take complete a graphing experiment using monkeys in a bag. Students graph their results on the piece of paper.
Other popular searches
- Coordinate Picture Graphs
- Christmas Picture Graphs
- M&m Picture Graphs
- Hidden Picture Math Graphs
- Picture Graphs Worksheets
- Math Lessons Picture Graphs
- 5th Grade Picture Graphs
- Bar and Picture Graphs
- Thanksgiving Picture Graphs
- Circle and Picture Graphs
- Picture Graphs Template
- Reading Picture Graphs


