Curated OER
Probability and Statistics
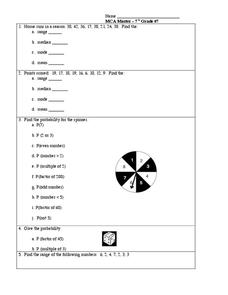
In this probability and statistics activity, students complete 5 problems regarding range, mean, median, mode, and a spinner probability problem.
Curated OER
Business & Statistics: Final Exam
For this business and statistics worksheet, students read real-life business problems, arrange data, and identify the probability method best used to determine the answer. They identify the type of random sample, draw stem-and-leaf...
Curated OER
Data Analysis and Probability
Students design models to simulate actual events using various random devices. They estimate the likelihood of a particular outcome using results of simulation. In addition, they simulate the births of three children to a using a coin.
Curated OER
Candy Problem
In this stats worksheet, students identify how many ways there are to split 25 pieces of candy in between 3 people. There is a very detailed answer key with this problem.
Shodor Education Foundation
Introduction to the Concept of Probability
Acquaint mathematicians to the concept of probability with a discussion about the results of a game. Then have them play a dice, card, spinner, or coin game and recording the number of wins vs. the number of tries on an interactive web...
Shodor Education Foundation
Replacement and Probability
Middle and high schoolers explore the concept of probability. In this probability lesson, learners conduct an experiment with a bag of marbles. Pupils draw marbles from a bag and determine the probability of drawing a particular color...
Curated OER
A Statistical Study of the Letters of the Alphabet
Students gather appropriate information for simple statistical analysis. Then they will calculate probability working with a piece of literature that makes this lesson ideal for teaching across the whole curriculum.
College Board
Three Calculator Simulation Activities
Calculators sure come in handy. An AP® Statistics instructional resource provides suggestions for using calculator simulations. It gives activities for adding variances, normal probability plots, and t distributions.
College Board
Power in Tests of Significance
Test your knowledge of tests of significance. A curriculum model for AP® Statistics describes and defines power in terms of tests of significance. It also provides two classroom activities designed to investigate power and how it relates...
Howard Hughes Medical Institute
Mendelian Genetics, Probability, Pedigree, and Chi-Square Statistics
People with the sickle cell trait, but not sickle cell disease, find natural protection against malaria. Scholars consider various combinations of genotypes and environmental factors to determine if children might have sickle cell...
Curated OER
What's Math Got To Do With It?
Students explore numbers, computation, ratios, proportions, probabilities, statistics, and money in this six lessons unit. Practical applications in the real world are emphasized through an interactive approach to math in these lessons.
Curated OER
Graphs: All About Our Class
Students respond to survey questions, discuss results, brainstorm ways to represent survey information, and create table of class results. They find mean, range, and percentages, and create graph to display results.
Curated OER
Quick Stats with Quick Poll
Learners analyze data using bar graphs and the TI in this statistics instructional activity. They investigate quick polls and graph the data using different properties of statistics. This assignment requires a TI Navigator.
Curated OER
Data Analysis Using Technology
Analyze data using technology. Middle schoolers design data investigations, describe data, and draw their own conclusions. Then they select the best type of graph, graph and interpret the data, and look for patterns in trends. They also...
Curated OER
Simulation and Statistics
Students perform simulation of video games as they explore statistics. In this algebra lesson, students relate concepts of statistics and data collection to solve problems. They decide their next step based on the previous assessment of...
Curated OER
What are My Chances?
Students calculate the chance of an event occurring. In this statistics lesson, students use combination and permutation to calculate the probability of an event occurring. They differentiate between theoretical and experimental...
Curated OER
Past and Present: Using baseball statistics to teach math
Students use baseball cards to add up batting average and reinforce math skills. In this batting averages lesson plan, students use old baseball cards to practice different math skills and look at other baseball statistics.
Curated OER
What is Probability?
Learners participate in a variety of activities in order to understand the concept of probability. The students are engaged because of the application of The Multiple Intelligences Theory.
Curated OER
Penny's Pizza
Students develop a list of possible outcomes as a method of finding probability related to a pizza statistics problems. They read the problems together as a class, brainstorm ways to solve the problem, and in partners solve the pizza...
Curated OER
The Mathematical Implications of Lying
Learners explore how statistics can be interpreted in different ways. In this probability lesson students complete a class lab activity then discuss their findings.
Curated OER
Heads or Tails
Seventh graders compare experimental and theoretical probabilities. In this comparing experimental and theoretical probabilities lesson, 7th graders discuss the theoretical probability of flipping a coin. Students flip a coin 25 times...
Curated OER
The Monty Hall Problem
Young scholars define and differentiate between experimental and theoretical probability. In this statistic lesson, students play the game "Monty Hall" and use probability to come up with the best strategies to play the game.
Curated OER
Sorting Polygons
Tenth graders identify and classify polygons according to various attributes. In this sorting polygons lesson, 10th graders describe, classify and comprehend relationships among types of two-dimensional objects using their defining...
Curated OER
Chapter 5 Review
In this statistics worksheet, learners solve and complete 10 different types of problems. First, they determine the probability of various actions described. Then, students describe an appropriate model for the number described and...


