University of Cambridge
University of Cambridge: Maths and Sports: Who's the Winner?
If two goals are scored in a hockey match between two equally-matched teams, what are the possible scores? This activity gives an opportunity to investigate probability in the context of sport, and is designed to be accessible to...
Texas Instruments
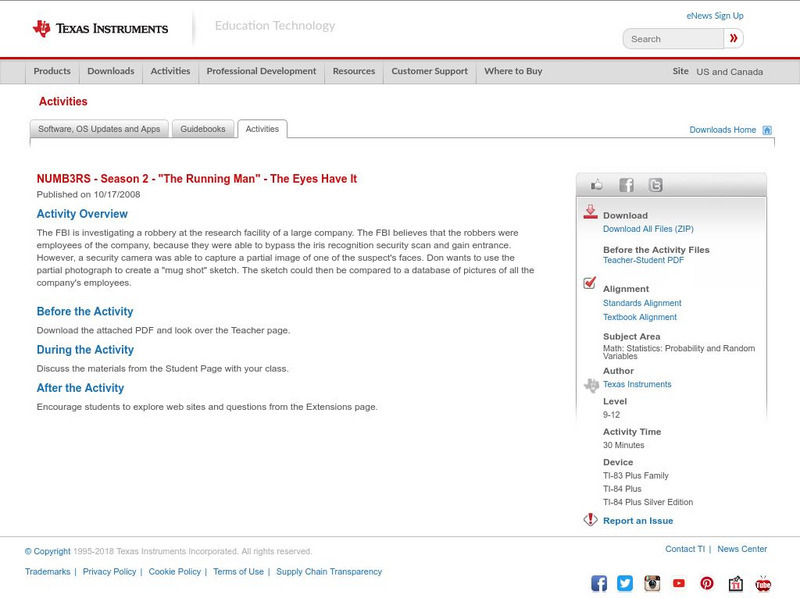
Texas Instruments: Numb3 Rs: The Eyes Have It
Based off of the hit television show NUMB3RS, this lesson lands students as investigators who must explore the usefullness of iris scan (security) algorithms. In the first part of a lesson, a given probability is used to determine how...
Alabama Learning Exchange
Alex: It's in the Bag!
It's in the Bag will allow learners to explore basic principles of probability. Students will investigation the likelihood of a certain color cube coming out of a bag. Then proceed to write word problems involving the plausible outcomes....
University of Cambridge
University of Cambridge: Maths and Sports: Any Win for Tennis?
What are the probabilities of winning at tennis? This challenging activity is designed to be accessible to students of A-Level Maths (grades 10, 11, and 12).
National Council of Teachers of Mathematics
The Math Forum: Traffic Jam Activity Lesson Plan
There are seven stepping stones and six people - three on the left facing the three on the right. How is it possible to have the three on the left end up on the right, and vice versa, while everyone was at all times standing on a stone...
Cyberbee
Adventures of Cyberbee: Graphing
Teacher-directed lesson plan focusing on data analysis, graphing, and probability. Lesson includes a video and engaging spreadsheet activities.
University of Baltimore
University of Baltimore: Geometric Mean
A complete definition of geometric mean in the statistical concept of the word. The discussion includes several examples of how geometric means are calculated and how/where they are useful. Written by Dr. Hossein Arsham.
Science Education Resource Center at Carleton College
Serc: Understanding the Standard Deviation: What Makes It Larger or Smaller?
Students develop a better intuitive understanding of what is meant by variability in statistics. Emphasis is placed on the standard deviation as a measure of variability.
ClassFlow
Class Flow: Probability
[Free Registration/Login Required] This flipchart gives students the opportunity for hands on exploration of probabilities using the dice tool and other real life probability cases. The lesson concludes with a 5 question Activote session.
Richland Community College
Richland Community College: Probability Definitions
This site, which is provided for by the Richland Community College, gives a list of probability definitions.
ClassFlow
Class Flow: Probability Spinner Handling Data
[Free Registration/Login Required] Students construct a probability spinner and then test, graph and analyze their data.
ClassFlow
Class Flow: Probability and Combinations
[Free Registration/Login Required] This flipchart is designed to help students understand probability and combinations. This flipchart includes games and activities to help illustrate the concept.
CK-12 Foundation
Ck 12: Statistics: Dependent Events and Sample Spaces Grades 9 10
[Free Registration/Login may be required to access all resource tools.] Covers the Multiplication Rule for dependent events.
CK-12 Foundation
Ck 12: Statistics: Independent Events and Sample Spaces
[Free Registration/Login may be required to access all resource tools.] Covers the multiplication rule for independent events.
Oswego City School District
Regents Exam Prep Center: Mutually Exclusive & Independent Events
The somewhat tricky differences between mutually exclusive, non-mutually exclusive, independent, and dependent events are defined here. Common items such as coins, colored cubes, and a deck of cards are all part of the easy-to-understand...
CK-12 Foundation
Ck 12: Statistics: Dependent Events and Sample Spaces Grades 9 10
[Free Registration/Login may be required to access all resource tools.] Covers the Multiplication Rule for dependent events.
Annenberg Foundation
Annenberg Learner: Learning Math: Min, Max and the Five Number Summary
Explore how to interpret a large set of data by dividing it up into smaller portions in order to answer statistical questions.
Common Core Sheets
Common Core Sheets: Statistics & Probability Finding Slope 8.sp.3 Worksheets
Print or create worksheets or flashcards to assess students' understanding of finding slope.
Common Core Sheets
Common Core Sheets: Statistics & Probability 7.sp.1 Worksheets
Create or print a worksheet to assess students' understanding of identifying populations and samples.
Other
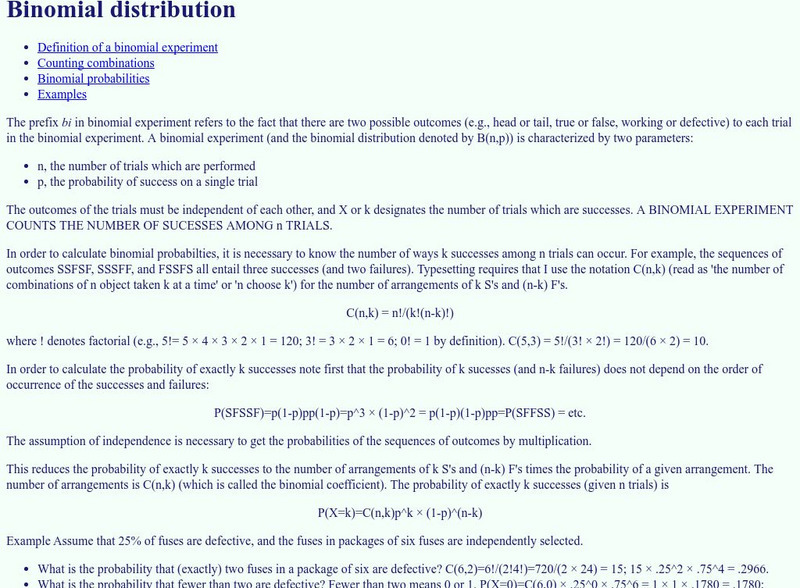
Introduction to Statistical Methods: Binomial Distribution
This site defines, explains, and gives examples of a binomial experiment. Also included other pages are sample tests of this and other topics.
Other
Statistics Education Web: Bubble Trouble [Pdf]
Use random sampling to formulate, collect, and compare data from two populations. Written by Peter Banwarth of Oregon State University.
Shmoop University
Shmoop: Basic Statistics & Probability: Scatter Plots & Correlation
The statistics resource explores scatter plots and correlation. Students learn about the concepts through notes and detailed examples. The resource consists of practice exercises to check for comprehension of the topics.
Khan Academy
Khan Academy: Discrete Random Variables: Expected Value
Compute the expected value given a set of outcomes, probabilities, and payoffs. Students receive immediate feedback and have the opportunity to try questions repeatedly or receive hints.
Khan Academy
Khan Academy: Hypothesis Testing in Experiments
Look at the results of different experiments, and determine if they are statistically significant. Students receive immediate feedback and have the opportunity to try questions repeatedly, watch a video or receive hints.


![Statistics Education Web: Bubble Trouble [Pdf] Lesson Plan Statistics Education Web: Bubble Trouble [Pdf] Lesson Plan](https://content.lessonplanet.com/knovation/original/715465-988c4be74f96df36c2d9bcb6f2f5182f.jpg?1661829195)


