Curated OER
Every Graph Tells A Story
Seventh graders explore linear equations. In this graphing lesson, 7th graders explore constant rates of change. Students discover the real-life application of graphs and demonstrate their ability to read graphs and write corresponding...
Inside Mathematics
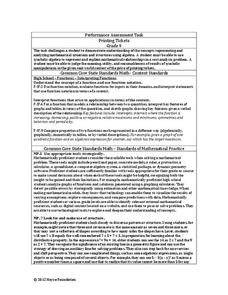
Printing Tickets
Determine the better deal. Pupils write the equation for the cost of printing tickets from different printers. They compare the costs graphically and algebraicaly to determine which printer has the best deal based upon the quantity of...
101 Questions
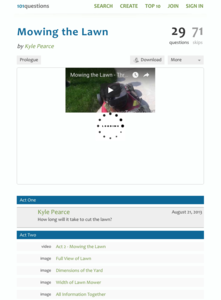
Mowing the Lawn
It'll take as long as it'll take. After watching a short video clip of someone moving a lawn as well as a running stopwatch, pupils estimate how long it would take to mow the entire lawn. Provided diagrams show the dimensions of the lawn...
Curated OER
Strike a Pose: Modeling in the Real World (There's Nothing to It!)
Adjust this lesson to fit either beginning or more advanced learners. Build a scatter plot, determine appropriate model (linear, quadratic, exponential), and then extend to evaluate the model with residuals. This problem uses real-world...
Alabama Learning Exchange
How Big Can a Bee Be?
Mathematicians analyze the relationships between surface area and volume. They conduct Internet research, conduct various experiments, record the data in a spreadsheet, and graph the results and compare the rate of increase of surface...
Ms. Amber Nakamura's Mathematics Website
Algebra Project
What would your dream house look like? A cottage? A medieval castle? High schoolers enrolled in Algebra design the perfect house while using slopes to write equations for various aspects of the project.
Charleston School District
Review Unit 3: Functions
Time to show what you know about functions! The review concludes a series of nine lessons on the basics of functions. The problems included are modeled from the previous lessons. Pupils determine if a table represents a function,...
EngageNY
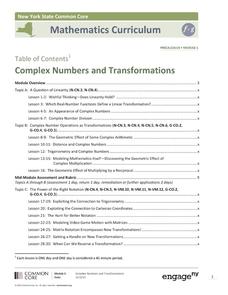
Complex Numbers and Transformations
Your learners combine their knowledge of real and imaginary numbers and matrices in an activity containing thirty lessons, two assessments (mid-module and end module), and their corresponding rubrics. Centered on complex numbers and...
Virginia Department of Education
Vapor Pressure and Colligative Properties
Hate to vacuum, but enjoy using a vacuum pump? Explore a lesson plan that starts with a demonstration of boiling water at various temperatures by using a vacuum pump. Then scholars design their own experiments to measure vapor pressure...
Curated OER
High School Mathematics Problems from Alaska: Writing an Equation: Fundraiser
Learners represent relationships between variables by writing, creating, and solving linear equations, and using tables and graphing.
Curated OER
Flow Rates of Faucets and Rivers
Students work together to discover the flow rates of faucets and rivers. They relate their results to engineering and applied science concepts. They make predictions on the flow rate of a nearby river in their local community.
Alabama Learning Exchange
Graphing Stations
Pupils explore the concept of graphing stations. In this graphing stations lesson plan, students head to various teacher set-up stations involving slope, point-slope, standard form, parallel lines, etc. Pupils work problems at each...
Albert Shanker Institute
Economic Causes of the March on Washington
Money can't buy happiness, but it can put food on the table and pay the bills. The first of a five-lesson unit teaches pupils about the unemployment rate in 1963 and its relationship with the March on Washington. They learn how to create...
Curated OER
Writing Equations in Slope-Intercept Form
Use this worksheet to write equations in both point-slope form and slope-intercept form. Start by writing equations given one point and the slope and finish by writing equations given two points and a few real-world applications. The...
Curated OER
A Special Relationship
Young scholars discover the relationships of the lengths of the sides of right triangles and right triangles using a series of drawings on dot paper. They investigate and solve problems of standard (customary and metric units) and...
Curated OER
Circle Relationships
Students explore circles. In this geometry instructional activity, students explore the relationship between the circumference of a circle, the distance a ball travels, and the number of rotations the ball must make in order to travel a...
Inside Mathematics
Squares and Circles
It's all about lines when going around. Pupils graph the relationship between the length of a side of a square and its perimeter. Class members explain the origin in context of the side length and perimeter. They compare the graph to the...
Inside Mathematics
Conference Tables
Pupils analyze a pattern of conference tables to determine the number of tables needed and the number of people that can be seated for a given size. Individuals develop general formulas for the two growing number patterns and use them to...
Rice University
Algebra and Trigonometry
Move on into trigonometry. An informative eBook takes the content of a College Algebra course and adds more relating to trigonometry and trigonometric functions. The content organization allows pupils to build upon their learning by...
Rice University
Precalculus
Take a step beyond Algebra 2. Learners use the eBook to learn concepts from the typical Precalculus course. Content starts off with a short review of functions in general and moves on to the basic functions, finishing up with more...
Cornell University
Math Is Malleable?
Learn about polymers while playing with shrinky dinks. Young scholars create a shrinky dink design, bake it, and then record the area, volume, and thickness over time. They model the data using a graph and highlight the key features of...
LABScI
Population Dynamics: The Predator-Prey Lab
Wolves eat better when the bunny population increases, but how long does that last? A series of 12 biology lessons uses the sixth installment to explore the predator-prey relationship between bunny and wolf populations. Young scientists...
Curated OER
Walking Home II
Young scholars explore the relationship between distance and time. They analyze a situation involving distance traveled in a given period of time, represent the situation graphically and algebraically, and discuss the concept of slope as...
Curated OER
Forces and Graphing
Students analyze graphs to determine relationships between variables and rates of change. They determine the basic concepts about static reaction forces. They determine the slope and equation of a line.


