Curated OER
A Real Difference
Fifth graders use the Celsius and Fahrenheit thermometers to compare temperature readings. They use the Internet to find the temperatures of selected cities. After data is collected for five days, 5th graders graph the temperatures.
Curated OER
Heads-Up Probability
Second graders use tree diagrams to predict the possible outcomes of coin tosses. The data they collect and graph also help them predict the likelihood of getting heads or tails when tossing coins the next time.
Curated OER
The Stock Exchange Phase I
Second graders select a stock and follow its ups and downs, using graphs to show its success.
Curated OER
We Are Having a Party! Part I
Second graders use data analysis skills in order to plan a class party. They graph possible times for the party noting the range for times. They discuss how mathematicians find and use the range to analyze data.
Curated OER
It's Your Choice
Students compare data and determine the appropriate way to organize the data. They use physical graphs, pictographs, and symbolic graphs to display their data. In addition, they complete a Venn diagram.
Curated OER
Constellations
Learners explore constellations. They read trade books about constellations and write notes including their locations, origins, and names. They research and report on one constellation in the Northern Hemisphere and share their report...
Curated OER
Introduction to Science
Seventh graders investigate scientific methods to solve problems. They demonstrate creating data tables and graphs. They study the role of a scientist and the importance of safety in a science lab. They distinguish between an...
Curated OER
Points in a Complex Plane -- Lecture
Students review plotting points on a coordinate plane. Individually, they add and subtrace complex numbers and graph them in a complex plane. They follow along a worksheet while their teacher lectures on the new material and solve...
Curated OER
Environmental Mathematics
Eighth graders determine food that they would need to survive in the wild. They graph the best foods for their environments and rate the survivability rate for each member of their group.
Curated OER
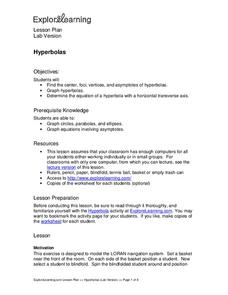
Hyperbolas
Students find the center, foci, vertices, and asymptotes of hyperbolas. They graph hyperbolas and determine the equation of a hyperbola with a horizontal transverse axis. They derive general coordinates for the foci of a hyperbola with a...
Curated OER
Hyperbolas
Students locate and identify the center, foci, vertices, and asymptotes fo hyperbolas. They graph equations involving asymptotes and hyperbolas. Finally, students determine the equation of a hyperbola with a horizontal transverse axis.
Curated OER
Absolute Value of Linear Functions
Students identify and interpret how absolute value affects linear functions. They also graph linear functions and reflect them in a line of symmetry. Finally, students evaluate the absolute value of a constant using technology to...
Curated OER
Absolute Value of Linear Functions
High schoolers discover how abolute value affects linear functions. They complete a worksheet simulating a path for miniature golf hole in one for three figures. They construct a hole in one graph for each hole marking the X and Y...
Curated OER
Chessboard Challenge
Second graders read "The King's Chessboard" by David Birch. The teacher reads the story aloud and pauses at several points for students to calculate the next number in a pattern of doubling.
Curated OER
Exploring Geometric Figures
Tenth graders explore mathematics by participating in hands-on daily activities. Learners identify a list of different shapes and classify them by shape, size, sides and vertices. They utilize tangrams and geometric pieces to gain an...
Curated OER
FLIGHT FAIR
Young scholars conduct their personal investigations into paper airplane flight. Cooperative teams are formed, with students choosing the paper airplane design that they are most interested in building.
Curated OER
Good Health Care
Students work in collaborative groups researching topics such as nutrition, the benefits of exercise on the body, dental and personal hygiene. They conduct interviews, create charts and posters, and report their results with a written...
Curated OER
Does One Tree a Forest Make?
Students take a walk around the schoolyard looking at and identifying the trees. One leaf for each tree is collected. A chart is developed that represents the population of trees on the school ground. They keep journals and write an essay.
Curated OER
Statistics with State Names
Students analyze the number of times each letter in the alphabet is used in the names of the states. In this statistics lesson, students create a stem and leaf plot, box and whisker plot and a histogram to analyze their data.
Curated OER
My Car Has Potential
Seventh graders investigate how changes in the mass or height of a ramp can affect the change in potential energy. They discuss the concepts of work and energy, then using the four question strategy, they design an experiment that...
Curated OER
Touch Math
Using the touch math system, learners engage in activities to practice adding numbers. While the lesson is laid out in an explicit manner, there isn't a guide explaining the touch math system.
Kelly's Kindergarten
June Daily Activities
This is an absolute must-have resource for early elementary teachers! Here you'll find a collection of activities and worksheets for each day of the month of June, with topics ranging from ordering numbers on a calendar or identifying...
PBS
Accessible Shapes
All the 2-D and 3-D measurement work you need is in one location. Divided into three sections, the geometry lesson plans consist of visualization of three dimensions, classifying geometric figures, and finding surface area and volume....
Curated OER
The Dog Days of Data
Students practice an alternative form of data presentation. They practice sequencing data, identifying the stem-and-leaf, creating stem-and-leaf plots, and drawing inferences from the data by viewing the plots.


