Noyce Foundation
Parallelogram
Parallelograms are pairs of triangles all the way around. Pupils measure to determine the area and perimeter of a parallelogram. They then find the area of the tirangles formed by drawing a diagonal of the parallelogram and compare their...
Noyce Foundation
Photographs
Scaling needs to be picture perfect. Pupils use proportional reasoning to find the missing dimension of a photo. Class members determine the sizes of paper needed for two configurations of pictures in the short assessment task.
Noyce Foundation
Pizza Crusts
Enough stuffed crust to go around. Pupils calculate the area and perimeter of a variety of pizza shapes, including rectangular and circular. Individuals design rectangular pizzas with a given area to maximize the amount of crust and do...
Inside Mathematics
Vencent's Graphs
I like algebra, but graphing is where I draw the line! Worksheet includes three multiple-part questions on interpreting and drawing line graphs. It focuses on the abstract where neither axis has numbers written in, though both are...
Virginia Department of Education
Analyzing and Interpreting Statistics
Use measures of variance to compare and analyze data sets. Pupils match histograms of data sets to their respective statistical measures. They then use calculated statistics to further analyze groups of data and use the results to make...
Virginia Department of Education
Measuring Mania
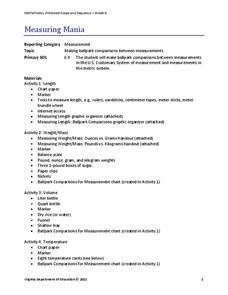
Conversion immersion — it's measuring mania! A set of four activities teaches scholars to convert between customary and metric units. Resource covers unit conversions in length, temperature, weight/mass, and volume.
Curated OER
Family Activity: Bar Graphs and Line Graphs
In this math worksheet, students work at home with a family member on a graphing activity. Students count the number of cans, glass jars, boxes and bags in the pantry. Students make a bar and a line graph to represent the data.
Curated OER
Maps- Looking at Map Scales
In this map scale worksheet, learners examine how to convert measurements on a map. They read 5 examples before completing 8 multi-step conversion problems. They insert the answers in an online version of the worksheet to determine if...
Noyce Foundation
Mixing Paints
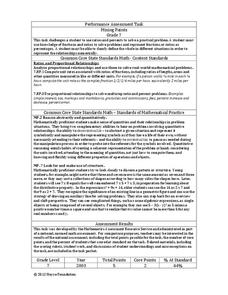
Let's paint the town equal parts yellow and violet, or simply brown. Pupils calculate the amount of blue and red paint needed to make six quarts of brown paint. Individuals then explain how they determined the percentage of the brown...
K12 Reader
Galileo and His Telescope
Learn about Galileo Galilei's contribution to modern science with a reading passage that focuses on reading comprehension. After kids read several paragraphs about his life, they answer five questions about the information they have just...
Inside Mathematics
Scatter Diagram
It is positive that how one performs on the first test relates to their performance on the second test. The three-question assessment has class members read and analyze a scatter plot of test scores. They must determine whether...
Inside Mathematics
Suzi's Company
The mean might not always be the best representation of the average. The assessment task has individuals determine the measures of center for the salaries of a company. They determine which of the three would be the best representation...
Inside Mathematics
Rugs
The class braids irrational numbers, Pythagoras, and perimeter together. The mini-assessment requires scholars to use irrational numbers and the Pythagorean Theorem to find perimeters of rugs. The rugs are rectangular, triangular,...
Curated OER
Using Inequalities to Problem Solve
Students explore inequalities. For this Algebra I lesson, students solve and graph linear inequalities involving addition, subtraction, multiplication, or division. Students use inequalities to solve and graph real-world problems.
Curated OER
Percentages and Fractions of Amounts
In this math worksheet, students change percents to fractions on five problems. Students complete a table. Students find a given percent of five numbers. They complete five story problems involving percents.
Helping with Math
#10: Solving Equations (2 of 2)
In this prealgebra activity, pupils perform addition, subtraction, multiplication, or division operations to solve for an unknown. There are 12 problems to be solved. Use this as a quiz to assess how well your class is grasping the skill...
Curated OER
Addition
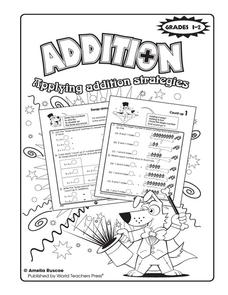
In this addition activity, students enhance their simple addition skills using addition strategies to solve the two worksheets of addition problems.
Achieve
Corn and Oats
How much land does a parcel hold? How much fertilizer does it take for a field of corn? Pupils answer these questions and more as they apply ratio reasoning and unit analysis.
Noyce Foundation
Snail Pace
Slow and steady wins the race? In the assessment task, scholars calculate the rates at which different snails travel in order to find the fastest snail. Hopefully, your class will move much more quickly in finishing the task!
Curated OER
Bar Graphs
In this bar graph worksheet, students complete math problems having to do with different bar graphs. Students complete 10 problems for 10 different graphs.
California Education Partners
Photos
Why do all sizes of pictures not show the same thing? Class members analyze aspect ratios of various sizes of photos. They determine which sizes have equivalent ratios and figure out why some pictures need to be cropped to fit particular...
K12 Reader
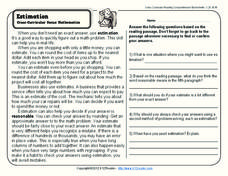
Estimation
When is it a good idea to use estimation? Learn about estimation and rounding with a reading comprehension lesson. After kids read a passage about estimation, they answer five comprehension questions on the other side of the page.
Curated OER
Passive Integrator and Differentiator Circuits
In this circuits worksheet, students answer 25 questions about passive integrator circuits and passive differentiator circuits given schematics showing voltage. Students use calculus to solve the problems.
Curated OER
Travel Problems
This worksheet is actually an entire chapter focused on math problems involving, shortest path, minimum connector, traveling salesman, and Chinese postman problems. There are multiple activities, exercises, and examples to get students...


