Palomar Community College District
Palomar College: The Normal Curve an Example
A collection of step-by-step worked problems demonstrating how to take a normal curve and determine the probability (area) under it. Hints are provided along the way and the final measures are shown for the user to check.
Other
Fayetteville State University: Z Distributions
The introductory paragraph explains Z-Distributions, their spread, and the ability to find certain values within the distribution. Two animated graphs are then provided as an example of the probability of the normal distribution curve.
Web Center for Social Research Methods
Research Methods Knowledge Base: Sampling in Research
Site discusses the use of sampling in research. The key statistical terms used in sampling are linked for the user to quickly find definitions. The major concepts of probability and nonprobability are also highlighted.
Stefan Warner and Steven R. Costenoble
Finite Mathematics & Applied Calculus: Random Variables and Distributions
Students examine random variables and distributions. Topics explored are probability distributions, and discrete and continuous random variables. The tutorial investigates the statistics concepts through class notes and examples. Review...
Oswego City School District
Regents Exam Prep Center: Independent and Dependent Events
Explains how to calculate the probabilities of independent and dependent events. Includes easy-to-follow examples.
Stefan Warner and Steven R. Costenoble
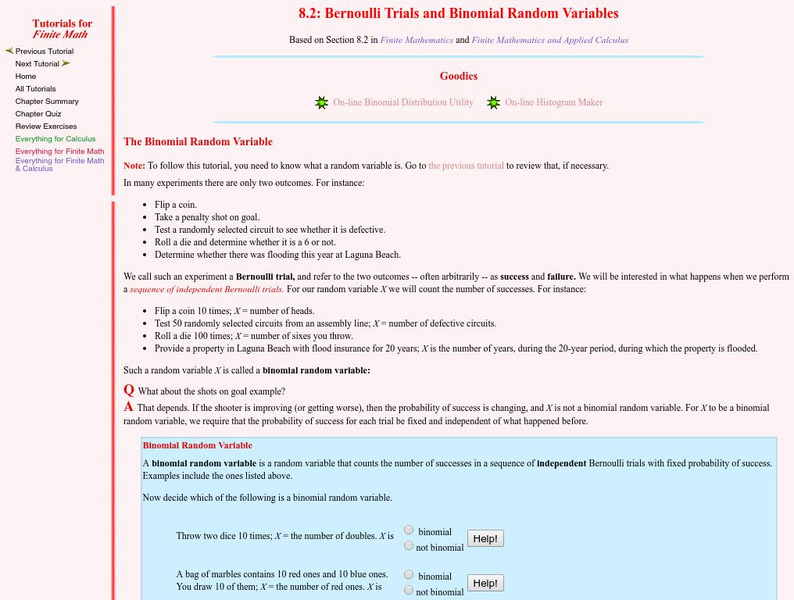
Finite Mathematics & Applied Calculus: Bernoulli Trials and Binomial Random Variables
Students learn about Bernoulli trials and binomial random variables. The tutorial investigates the statistics concepts through class notes and examples. Review exercises and a chapter quiz are included.
Illustrative Mathematics
Illustrative Mathematics: S cp.a.1, S cp.a.4, and S cp.b.6: The Titanic 1
On April 15, 1912, the Titanic struck an iceberg and rapidly sank with only 710 of her 2,204 passengers and crew surviving. Data on survival of passengers are summarized in the table below. (Data source:...
California State University
Cal State San Bernardino: Intro to Probability Models
The concept of random variables comes to life with this Applet used to roll one, two, six, or nine dice. The user selects the number of rolls to be completed, and the program quickly counts and graphs the results.
University of Glasgow
Steps Statistics Glossary: Sampling Distribution
This site provides an overview of sampling distribution and associated terms.
Other
Berrie's Statistics Page: Central Limit Theorem
Brief definition and example of the Central Limit Theorem.
Other
Web Quest: Take Me Out to the Ball Game
This is a WebQuest written by Susie Hallar of the Warrensburg Schools in Warrensburg, Missouri. Students research 10 famous baseball players, then use the information they find to compute averages, standard deviations, central...
University of Cambridge
University of Cambridge: Maths and Sports: David and Goliath
Does weight give shot putters an advantage? This activity encourages students to engage in statistical analysis, and is aimed at GCSE and A-level students (Key Stages 4 and 5).
Famous Scientists
Famous Scientists: Daniel Bernoulli
Read a short biography about Daniel Bernoulli, and find out about his work in fluid mechanics, and his pioneering work in probability and statistics.
Texas Instruments
Texas Instruments: Using the Ti 83/84 to Explore the Binomial Theorem
This lesson will introduce students to the binomial theorem through a variety of activities. Pascal's triangle and probabilities will be explored through problem solving. The binomial theorem, combinations formula, and the binomial...
Texas Instruments
Texas Instruments: What Are the Chances?
In this activity, students determine the probability of a spinner landing on a certain number in eleven trials. They also learn to change the weightage and find subsequent effect on the probability.
Ministry of Education and Universities of the Region of Murcia (Spain)
Ministerio De Educacion Y Ciencia: El Azar Y La Probabilidad.
In Spanish. This is an interactive activity which introduces the basic concepts of probability theory. This unit ends with a first look at the probability of compound events.
Texas Instruments
Texas Instruments: Numb3 Rs: Is It for Real?
Based off of the hit television show NUMB3RS, this lesson uses sabermetrics (study of statistics of baseball) to try to determine when certain players had "change points," or times when their performance drastically changed. This is done...
Texas Instruments
Texas Instruments: Spin Me Along
Students explore probability and patterns in fractions, decimals, and percents by spinning three spinners and recording and analyzing the results.
Texas Instruments
Texas Instruments: Venn Diagrams
This set contains statistics questions about Venn diagrams. The student interprets when a Venn diagram suggests such event pairs as mutually exclusive, complementary, and independent events, and uses these diagrams in determining...
Texas Instruments
Texas Instruments: Weather Study With Ti Interactive
Students will extract weather data from the web for several major cities. They will then display and discuss the data.
Texas Instruments
Texas Instruments: Tiles in a Bag
How many tiles would you have to pick to be confident that your estimated probability truly represents the situation? In this activity, you will draw a tile from a bag, record its color and put it back in the bag. The bag contains 24...
Science and Mathematics Initiative for Learning Enhancement (SMILE)
Smile: Smile: Smile Program Mathematics Index
This site provides lesson plans for various math topics, including probability, geometry, algebra, trigonometry, patterns, applied math.
Stefan Warner and Steven R. Costenoble
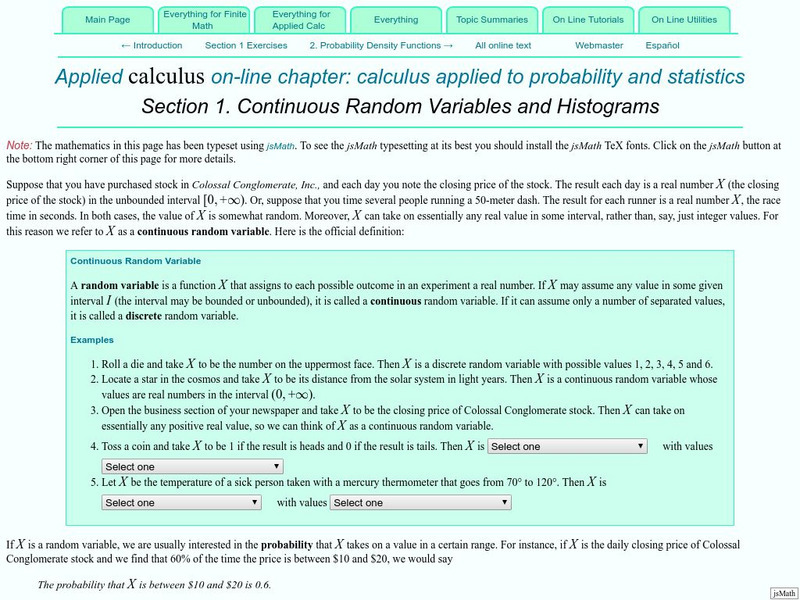
Finite Mathematics & Applied Calculus: Continuous Random Variables and Histograms
Students learn about random variables and histograms. Topics explored are continuous random variables, discrete random variables, probability, and frequency distributions. The tutorial investigtes the statistics concepts through class...
Ministry of Education and Universities of the Region of Murcia (Spain)
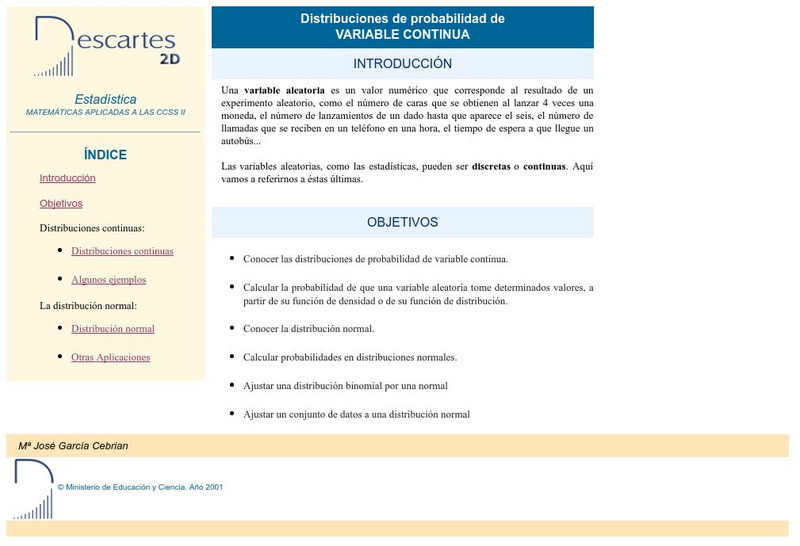
Ministerio De Educacion Y Ciencia: Distribuciones De Probabilidad
Learn about normal distribution, calculate odds on normal distributions and fit a set of data to a normal distribution.


