Inside Mathematics
Winning Spinners
Winning a spin game is random chance, right? Pupils create a table to determine the sample space of spinning two spinners. Individuals determine the probability of winning a game and then modify the spinners to increase the probability...
EngageNY
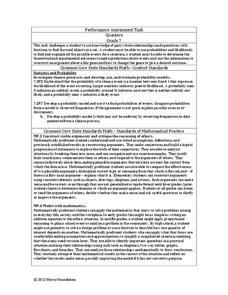
Mid-Module Assessment Task: Grade 7 Mathematics Module 5
Determine the probability that the class knows probability. The three-question assessment presents problems with finding the sample space and the probability, theoretical and experimental, of a variety of situations. Pupils also describe...
Noyce Foundation
Counters
For some, probability is a losing proposition. The assessment item requires an understanding of fraction operations, probability, and fair games. Pupils determine the fractional portions of an event. They continue to determine whether...
Intel
Fair Games
Who said things were fair? The unit introduces probability and its connection to fairness. The class interacts with activities of chance and plays games to relate them to fairness. Groups design a fair game and develop a presentation....
Curated OER
Probability and Statistics
Elementary schoolers choose from a host of activities to investigate probability and statistics. They complete worksheets, create 3-D graphs, and play graph bingo. They make weather predictions and list all the possibilities before going...
Curated OER
Most Likely/Least Likely
Learners consider a practice problem which prompts them to choose the type of marble most likely to be picked out of a group. Then, they answer probability-type questions regarding a spinner, and a tally chart of coins.
Google
The Law of Large Numbers and Probability
Learners investigate why theoretical probability doesn't always match reality. The activity involves using Python 2.7 (or Sage) to set up a Bernoulli Trial. It also involves setting up a spreadsheet to simulate the Birthday Paradox....
PHET
Plinko Probability
It's a good thing the resource dropped into your radar. Young mathematicians use an app that randomly drops balls through a Plinko game and into bins. They compare the distribution to that of an ideal binomial distribution.
Centre for Innovation in Mathematics Teaching
Ten Data Analysis Activities
This thirteen page data analysis worksheet contains a number of interesting problems regarding statistics. The activities cover the concepts of average measurements, standard deviation, box and whisker plots, quartiles, frequency...
Curated OER
Capture/Recapture
Students use proportions to estimate the size of populations. They describe the data with using a graph or table of the estimate. Students use descriptive statistics to calculate mean, median, and mode. They also compare and contrast an...
Curated OER
Combinations and Permutations
In this statistics worksheet, students solve the probability of an event occurring using probability, permutation and combination. There are 17 questions with an answer key.
Curated OER
Yes or No Logic Problem
In this statistics worksheet, students solve word problems using statistics and probability. They solve a riddle identifying the probability of the event occurring.
Curated OER
Emperical Probability
In this statistics and probability worksheet, high schoolers determine the experimental probability of an event occurring. The two page worksheet contains a combination of nine multiple choice and free response questions. Answers are...
Curated OER
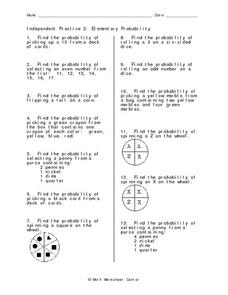
Independent Practice 2: Elementary Probability
In this probability worksheet, students identify the probability of given events. Problems include topics such as determining the probability of a tossed coin, picking a specified card from a deck of cards, spinning a wheel, and rolling...
Curated OER
Probability
In this math worksheet, students investigate the concept of probability. They read the list for the applications of the concept to the areas of statistics, political science, science, etc...
Curated OER
Probability
In this probability worksheet, students solve and complete 16 various types of problems related to statistics. First, they determine the probability of the statistics that are true as shown. Then, students find the conditional...
Curated OER
The Polar Bear Game
In this statistics worksheet, students answer questions about the probability of an even occurring using dices. They keep tract of their data using a table and analyze the data to make predictions. There are 12 questions with no answer key.
Curated OER
Statistical Process Control
In this statistical process control activity, students solve and complete 15 various types of problems. First, they estimate the standard deviation of the given process. Then, students use the target value as a center line and draw a...
Curated OER
Game of Fifty
In this statistics worksheet, students play a game of fifty. The object of the game is to reach fifty before anyone else. This is fun game to review addition and odd and even numbers.
Curated OER
The Handley Golf Problem
In this statistics activity, students solve a word problem about golf. They keep a score card, analyze their data on the score card and draw conclusions based on their data. There are 2 questions.
Curated OER
Scatterplots
Students evaluate equations and identify graphs. For this statistics lesson, students identify plotted points on a coordinate plane as having a positive, negative or no correlation. They complete basic surveys, plot their results and...
Curated OER
Data and Scientific Graphs
Students conduct experiments and graph their data. In this statistics lesson, students collect data and graph it on a coordinate plane. They analyze the data looking for patterns and they discuss their findings with the class.
Curated OER
Probability and Statistics
Students are taught to search the internet for statistics concepts on sports. In this probability lesson, students collect data and use the calculator to graph and analyze their data. They graph and make predictions about sports using...
Curated OER
Probability and Sports
Students explore the concept of probability in sports. In this probability in sports lesson plan, students research a sport that they enjoy. Students find probability information related to their sport. Students share their findings with...


