Curated OER
Parts of a Whole
Fourth graders explore fractions through the analysis of various paintings. They view and discuss paintings by Picasso and Seurat, discuss the fractional examples in the paintings, and create a bar graph.
Curated OER
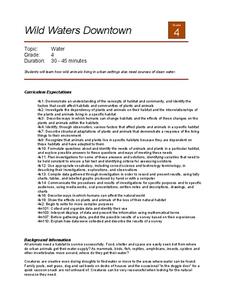
Wild Waters Downtown
Fourth graders investigate how wild animals living in urba settings also need sources of clean water. They discuss the open water issues of West Nile Virus and what happens to urba animals as these poolings area are cleaned up. ...
Curated OER
Wat-er We Good For?
Fifth graders investigate the use of water as a resource that needs to be conserved. They practice the skill of water conservation by taking a home survey of water usage and modify the use in order to decrease the wasting of water.
Curated OER
Graphs Abound
Young scholars create a survey for their classmates to collect data on their favorite foods, eye color, pets or other categorical data. They compile the data from the survey in a table and then make a bar graph of each category using a...
Curated OER
Creating and Designing a Database of Class Library Books
Students are shown how to create their own database using different field types. They are taugt how to design their own layout-chaning font or size and color of text, adding background color and clipart. Students interrogate their...
Curated OER
Graphing Our Favorite Candy Bars
Students use ClarisWorks to graph class' favorite candy bars on a bar graph.
Curated OER
Student Costs Graph
Students calculate the mileage, gasoline costs, and travel time and costs for a vacation. They conduct a virtual field trip, and create a comparison graph of costs using Microsoft Excel software.
Curated OER
Probability with Number Cubes
Second graders make sampling predictions, predict outcomes and explore probability through experimentation.
Curated OER
Creating Graphs from Tables
Students interpret data from tables and then create a graph to show the same data in a different organization.
Curated OER
Paper Parachutes
Students participate in a simulation of a parachute-jump competition by making paper parachutes and then dropping them towards a target on the floor. They measure the distance from the point where the paper parachute lands compared to...
Curated OER
What's the Chance?
Students study probability and statistics by conducting an experiment, recording their results, and sharing data with classmates.
Curated OER
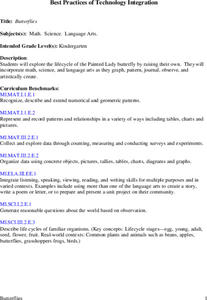
Butterflies
Students will explore the life cycle of the Painted Lady butterfly by raising their own. They will incorporate math, science, and language arts as they graph, pattern, journal, observe, and artistically create.
Curated OER
Jelly Belly: What a Wonderful "Bean"!
Students explore how jelly beans are produced. They discuss the origins of the jelly bean and view a video about how jelly beans are prepared, tested, shaped, finished, and shipped and estimate the amount of jelly beans in a jar and sort...
Curated OER
Graphing Regions: Lesson 2
Students identify and analyze geographical locations of inventors. They each identify where their inventor is from on a U.S. map, discuss geographic patterns, and create a t-chart and graph using the Graph Club 2.0 Software.
Curated OER
Calendar Communication
Students identify days, dates, and month on a calendar. In this calendar lesson, students use a blank calendar page and fill in the days of the month. Students recall what they learned on specific days and record that information as well.
Curated OER
Bird Feeding and Migration Observation
Students research bird migration and build a bird house. In this bird lesson plan, students research the birds in their area and where they migrate to. They also build their own bird house and record data on what kinds of birds come to...
Curated OER
Gathering, Recording, and Presenting Data
Sixth graders use the local newspaper to find and discuss examples of uses of statistics and the ways in which the information is presented. They create and represent their own set of data showing how students get to school each day.
Curated OER
The Difference Between Comets, Meteors And Asteroids
Students use Venn diagrams to highlight the similarities and differences between comets, meteors, and asteroids.
Curated OER
Arrange the Classroom (Part 1 of 3)
Fifth graders arrange the classroom using all the moveable objects and through the exploration of area and perimeter. They determine the area of the classroom, create and label model pieces of furniture using graph paper, and create a...
Curated OER
Design-A-Room Project (Part 3 of 3)
Students culminate a unit on measurement with a focus on area and perimeter. They design a floor plan of their dream room on graph paper showing the proper area and perimeter. They plan the budget for their room and make a 3-D scale...
Curated OER
Graphing Family Reading Habits
Second graders collect data from their families about their reading habits and graph them. In this graphing family reading habits instructional activity, 2nd graders interview family members about their reading habits. They then use a...
Curated OER
Growing as a Group
Students design a plan to help families who are in need. In this citizenship instructional activity, students brainstorm and implement a service project in their own community. Students discuss how to provide food for families who are in...
Curated OER
Weather Report Chart
Young scholars complete a weather report chart after studying weather patterns for a period of time. In this weather report lesson plan, students measure temperature, precipitation, cloud cover, wind speed, and wind direction for a...
Curated OER
Guess What I Came From
First graders examine items made from plants. In this plant lesson plan, 1st graders read Plants Feed on Sunlight and view a PowerPoint presentation regarding plant growth. Students examine products that are made from plants and draw...
Other popular searches
- Tally Charts and Pictographs
- Tally Charts and Tables
- Tally Charts or Pictographs.
- Math Tally Charts
- Primary Tally Charts
- Sorting and Tally Charts
- Tally Charts Mode
- Using Tally Charts
- Lucky Charms Tally Charts
- Birthday Tally Charts
- Tally Charts Lesson Plans
- Halloween Candy Tally Charts


