Curated OER
Basic Government for Primary Students
First graders participate in a T chart to answer if they would like to run for office or not and then write a journal entry about if they would or not. For this government lesson plan, 1st graders learn new government vocabulary by...
Curated OER
Glad To Meet You
Students explore patterns. In this patterns lesson, students explore patterns in hand-shaking scenarios. Students work in groups to predict and record the number of handshakes that occur in a group.
Curated OER
Apple Eaters
Students sample a variety of apples and graph group results for the class favorites. They orally explain the graph.
Curated OER
Virtual Field Trip
Learners calculate gasoline cost per mile on a virtual field trip. They calculate the gasoline costs and travel time for each of the 2 routes, and record on a data sheet. They use Excel to create data tables for mileage, gasoline...
Curated OER
Virtual Field Trip / Route, Mileage and Gasoline Cost Graphs
Students use a spreadsheet program to graph and compare milage, gasoline costs and travel time for two travel routes in their virtual field trip in Michigan. They determine the most economical route based on the graphs and calculations.
Curated OER
It's Your Choice
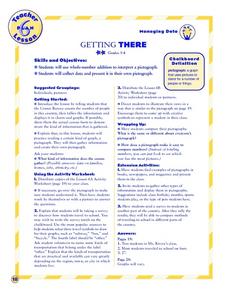
Students compare data and determine the appropriate way to organize the data. They use physical graphs, pictographs, and symbolic graphs to display their data. In addition, they complete a Venn diagram.
Curated OER
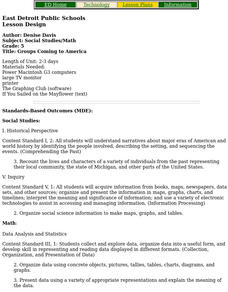
Groups Coming to America
Fifth graders use text or other references to locate different types of information about the Mayflower and pilgrims. They create a presentation for lower elementary classes about the Pilgrims.
Curated OER
Graph and Compare the Adventure's Temperature Vs. Local Temperature
Students explore the concept graphing data. In this graphing data lesson, students use weather data from their local weather and some other city and graph them. Students plot the local weather vs. another city. Students record...
Curated OER
Cinderbank
Fourth graders identify major components of a "Cinderella" story in order to create a database.
Curated OER
Questions for Today: Communities
Students discover how questionnaires help communities to determine the needs of its citizens. They make an analogy between a survey of students about their school and a survey of citizens about their community.
Curated OER
Saving An Endangered Species
Second graders work in groups in order to look at specific internet sites for animal adoption and sponsorship. They select an endangered species, determine needed funds, develop, advertise, and carry out a fund-raising plan.
Curated OER
Graphing Pockets
Second graders explore graphing. They count the number of pockets on their clothes and use Microsoft Excel to enter their data. Students create a class graph displaying their findings.
Curated OER
Virtual Field Trip / Activity Research
Students visit a website to determine activities at three Michigan cities. They calculate the total cost of participating in the activities or visiting places such as zoos, planetariums, historic sites, and museums.
Utah Education Network
Uen: Tallies Tell It All
This math lesson engages students into mathematical activities. Students will learn about tallying and data collection.
Illustrative Mathematics
Illustrative Mathematics: Number of the Day
Repeatable, daily activities are one of the best ways to instill the counting sequence for children. This activity requires a 100 chart which can be made or purchased. Students will count the "Number of the Day" beginning with 1 on the...
Other popular searches
- Tally Charts and Pictographs
- Tally Charts and Tables
- Tally Charts or Pictographs.
- Math Tally Charts
- Primary Tally Charts
- Sorting and Tally Charts
- Tally Charts Mode
- Using Tally Charts
- Lucky Charms Tally Charts
- Birthday Tally Charts
- Tally Charts Lesson Plans
- Halloween Candy Tally Charts


