Curated OER
Zoo Favorites
First graders construct a class picture graph and tally grid that show their favorite zoo animals. They discuss the information the graphs show and complete a personal graph based on the class example.
Curated OER
Favorite Candy Bar Graph
Students decide on six different types of candy bars to include in a data collection activity. Working in small groups, they survey a target group in a set amount of time. They access a Internet based graphing tool to create a bar graph...
Curated OER
A Turkey for Thanksgiving - Lesson #2
Second graders investigate realistic fiction, holiday celebrations, making tally charts. For this multi-disciplinary lesson, 2nd graders listen to a story about Thanksgiving and one about the Chinese New Year to develop an understanding...
Curated OER
Shoeless Math
First graders sort and classify, and complete a T-chart using Students' shoes.
Curated OER
Pizza! Pizza!
Third graders tally, sort, and organize pizza orders from monthly school sales. They create an advertising campaign to promote the School Pizza Sale, record the data in graph form, compare and contrast the tallies throughout the year,...
Curated OER
Multiplication Snack Activity
Youngsters study multiplication facts by manipulating food in order to problem solve. They will use healthy snack items as manipulatives to solve various multiplication equations. Charts, tables, physical models, and so much more are...
Pennsylvania Department of Education
Volume and Surface Area
Build boxes using unit cubes to compare surface area and volume. The group performs multiple experiments to determine properties of volume, such as if it makes a difference which order the dimensions are multiplied in. Extensive...
Alabama Learning Exchange
Ice Cream Sundae Survey
Young scholars analyze data through graphs. They will complete a class survey on ice cream sundaes and tally and graph the responses. They then analyze the information from the class graph.
Curated OER
The Final Analysis: Cause and Effect, Fact and Opinion
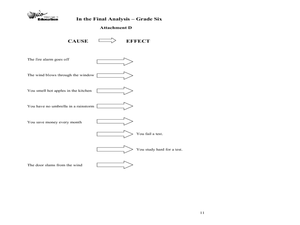
Middle schoolers read and review informational texts, analyze cause and effect, and distinguish fact from opinion. They assess a "one-minute mystery" you read aloud for cause and effect relationships. Resource includes complete set of...
Curated OER
Spreadsheet Graphs
Students create graphs using information from spreadsheets. They select a topic from the following choices: website use, digital cameras, spreadsheets, calculators or educational software. They tally the class results and create an...
Curated OER
Balloon Graphing
Fourth graders explore data, charts and graphs. They create graphs using titles, labels, axes, intervals, and scale correctly. Students enter their data into Excel and create a graph.
Curated OER
Chucky Chickadee's Bird and Breakfast: Sing in Please
Students observe bird feeding and complete a tally and graphing activity for their observations. In this bird graphing lesson plan, students work in teams to observe bird feedings. Students complete a bird reporting sheet and collect...
Curated OER
Student Costs Data Table
Students compare and contrast two routes selected for a virtual field trip. They create a data table of educational activities, lodging, and meal costs using Microsoft Excel software.
Curated OER
Virtual Field Trip
This hands-on resource has future trip planners analyze graphs of mileage, gasoline costs, and travel time on different routes. While this was originally designed for a problem-solving exercise using a Michigan map, it could be used as a...
Curated OER
Telling Time to 5 Minutes
In this second grade lesson your class will practice telling time. The goal is to tell time to five minutes using an analog clock. Your young students count by 5 minute intervals and discuss elapsed time.
Curated OER
Data Analysis
Students double check their data collections of Top 20 singles that they've been collecting for several days. Types of data is reviewed in detail and a variety of questions are asked for retention factors of mastery. They draw a tally...
Curated OER
Battery Power
Sixth graders examine how much energy they use in the form of battery power. They examine the cost of using regular vs. rechargeable batteries and examine the effect on the environment of the two types of batteries. They discover that...
Curated OER
Mathematics of Fair Games
Students examine mathematicians' notion of fairness in games of chance. They work in pairs to perform three different experiments using macaroni and paper bags. They record their results on charts and compare their data.
Curated OER
Virtual Field Trip
Are we there yet? Young trip planners learn about their state and plan a trip. They will select sites to see in three cities in their state, and record associated costs in a spreadsheet. While this was originally designed as a...
Curated OER
From There To Here...
Young scholars find out where some of the products in hour homes come from, then become aware of our local trash, landfills and incinerators. They chart and graph data and use maps for different purposes.
Curated OER
Snack Attack
Students design charts, tables, graphs, and pictographs to analyse the types of snacks in a bag.
Curated OER
Yummy Apples!
Students discuss apples and how they are grown. They listen as the teacher reads "Apples," by Gail Gibbons. Students discuss the story. They view several different types of apples and compare their characteristics. Students taste several...
Curated OER
Counting Candies
Learners count, sort, and classify jellybeans by color. They use their data to create a bar graph. Students are given a small bag of jellybeans, and a worksheet on Counting Candies Tally Chart. They work in small groups. Learners are...
Curated OER
Graphing Favorite Fruit
Third graders take poll and sort data, enter the data to create a spreadsheet and create bar and pie graphs.


