World Wildlife Fund
Bar Charts & Pie Charts
Learn about life in the Arctic while practicing how to graph and interpret data with this interdisciplinary lesson plan. Starting with a whole group data-gathering exercise, students are then given a worksheet on which they analyze and...
Curated OER
Many Ways to Represent Our Data
Demonstrate several ways to represent data with your class. They will use surveys to gather data and display the data using tally charts and graphs. Then answer questions according to the data.
Curated OER
Eat Your Veggies
Students investigate displaying data. In this displaying data lesson, students use tallies to count data about food preferences. Students use various types of graphs such as bar graphs, picture graphs, box-and-whisker plots, etc to...
Curated OER
Where We Live
Who has the most? Young learners practice charting data using familiar information. They help fill out a classroom chart by recording the number of people, pets, televisions, etc. in their home. Guiding questions help them investigate...
Curated OER
Comparing Data on Graph A and Graph B
Second graders gather and graph data. In this graphing lesson plan, 2nd graders collect data and graph this information using tally charts, bar graphs, pictographs, or tables. They make predictions about the outcomes.
Curated OER
What's Data?
Students get the opportunity to investigate the concept of data collecting. They explore how to tally and read a bar graph. Vocabulary about data is also be included. At the end of the lesson, individual students collect data independently.
Curated OER
Students Favorites
Students complete activities using a frequency table and construct a pie graph for the data. In this frequency table lesson, students complete a survey to find data for a frequency table. Students use the given link to make a pie graph...
Curated OER
A Class Census
Students recognize that data represents specific pieces of information about real-world activities, such as the census. In this census activity, students take a class and school-wide census and construct tally charts and bar graphs to...
Curated OER
Dynamite Data
Second graders rotate through a variety of stations designed to offer practice in manipulating data. They sort, tally and count items and then create bar graphs, tables, and pie graphs to record their findings.
Curated OER
Twelve Days of Christmas--Prediction, Estimation, Addition, Table and Chart
Scholars explore graphing. They will listen to and sing "The Twelve Days of Christmas" and estimate how many gifts were mentioned in the song. Then complete a data chart representing each gift given in the song. They also construct...
Curated OER
Sound Busters
Fourth graders engage in a study of sound pollution at their school. After a class discussion on what noise pollution is, learners are asked if they think there are areas of their school or community where noise pollution is a problem....
Curated OER
Tallying Animals
Second graders draw a picture of a pond scene which includes various animals. They exchange pictures and tally the number of animals drawn. Then they record the number on a chart and write a story about their pictures.
Curated OER
Counting Coins
Second graders identify a quarter, dime, penny, nickel, and dime. They match the coin with it's monetary value, collect data on excel spreadsheet, and create a graph in Excel. Students participate in group activities.
Curated OER
Graphing Data
First graders learn how to display data using a bar graph. In this bar graph lesson, 1st graders use data from a t-shirt color survey to make a bar graph. They also make an animal bar graph before interpreting the information.
Curated OER
And the Survey Says...
Learners use technology to input, retrieve, organize, manipulate, evaluate, and communicate information; apply appropriate technologies to critical thinking, creative expression, and decision-making skills. They collect and explore data...
Curated OER
Tally Time
Students create a tally chart. In this math and health instructional activity, students discuss healthy foods and create a tally chart showing the number of students who like to eat healthy foods.
Curated OER
Conservation of Energy
Fifth graders examine their use of energy over a certain time period. They come up with a plan to reduce their energy consumption and carbon footprint. Groups of learners complete a chart with three columns; energy-using events, the form...
Curated OER
Graphing With Candy
Students gather information and interpret the results using a tally chart, a table, and a bar graph.
Curated OER
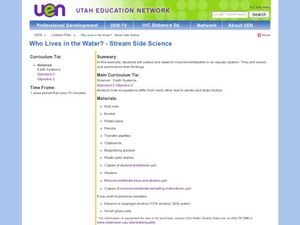
Who Lives in the Water? Stream Side Science
Andree Walker thought of everything when he wrote this resource. It includes a detailed list of materials and background information links for the teacher. In addition, it has procedures, a macroinvertebrate identification key, and tally...
Curated OER
Variation and Heredity
Junior geneticists tally eye color and height in their lab groups. They examine certain traits in soybean and corn seedlings. For each activity, they gather data and learn about continuous and discontinuous genetic variation. In another...
Curated OER
Volume, Mass, and Weight
Study the difference between mass and weight. Your math group will compare the weight of an item to the amount of space that it uses. They'll then use conversion factors to find the difference between kilograms and pounds. Essential...
Curated OER
M&M Math
Pupils sort a bag of M&M candies according to color using a sorting mat. They count M&M candies. They compare the number to their prediction then students create tally charts.
Curated OER
Party, Party, Party
Second graders conduct investigations with counting, comparing, organizing, analyzing, displaying and interpreting data. They pose questions for investigation and collect the data. Students display the data in tally charts, uniform...
Curated OER
Yummy Math
Young mathematicians use bags of Skittles to help them gain practice in graphing and organizing data. They work in pairs, and after they have counted and organized their Skittles, they access a computer program which allows them to print...


