EngageNY
Events and Venn Diagrams
Time for statistics and learning to overlap! Learners examine Venn Diagrams as a means to organize data. They then use the diagrams to calculate simple and compound probabilities.
Willow Tree
Histograms and Venn Diagrams
There are many different options for graphing data, which can be overwhelming even for experienced mathematcians. This time, the focus is on histograms and Venn diagrams that highlight the frequency of a range of data and overlap of...
Math Stars
Math Stars: a Problem-Solving Newsletter Grade 7
Put on your thinking caps because middle school math has never been more interesting in this huge resource full of thought provoking questions. Written as a newsletter, the resource has 10 two-page newsletters with a variety of...
Curated OER
Place the Numbers on the Venn Diagram
In this middle school mathematics learning exercise, students use a Venn diagram to sort a group of numbers into multiples of 2 or 3, or both. The one page learning exercise contains one problem with answer.
Public Schools of North Carolina
Math Stars: A Problem-Solving Newsletter Grade 1
Keep the skills of your young mathematicians up-to-date with this series of newsletter worksheets. Offering a wide array of basic arithmetic, geometry, and problem solving exercises, this resource is a great way to develop the critical...
Shodor Education Foundation
Sets and the Venn Diagram (Beginner)
Venn diagrams are helpful in understanding the idea of a set and using attributes to sort items. This basic plan is an introduction with an added bonus of an applet that can be used to demonstrate the activity. If a classroom of...
Shodor Education Foundation
Algorithm Discovery with Venn Diagrams
Here is a lesson that takes an interesting approach to analyzing data using box and whisker plots. By using an applet that dynamically generates Venn diagrams, the class forms a strategy/algorithm for guessing the rule that fits the...
Curated OER
Venn Diagrams
Young scholars collect and display data in a Venn Diagram. In this statistics lesson, students collect data, compare the data and make inferences about their data. They use the Venn diagrams to identify what the data have in common and...
Curated OER
Venn Diagrams: Write the Expression
In this Venn diagrams worksheet, students write the expression that best suits the Venn diagrams. Students complete 4 problems total.
Balanced Assessment
The Triskaidecaphobia Conference
Triskaidecaphobia is an extreme superstition to the number 13—and ironically the answer to the word problem is 13! Presented with a series of descriptive data, individuals analyze the data to determine the population size. They must...
West Contra Costa Unified School District
Introduction to Conditional Probability
Here is a turnkey instructional activity that walks young statisticians through the development and uses of conditional probability. From dice games to surveys, Venn diagrams to frequency tables, the class learns how a given can effect...
Curated OER
Four Always, Sometimes, or Never Venn Diagram Problems
In this Venn Diagram activity, students fill in the blanks with always, sometimes, or never by reading the Venn diagrams. The variables used in the Venn Diagrams are clearly defined.
College of Marin
General Addition and Multiplication Rules of Conditional Probabilities
Making connections between multiple methods of solving problems is an important part of understanding conditional probability. The lesson shows solutions to problems using Venn diagrams, tree diagrams, formulas, and two-way tables....
Curated OER
Building Venn Diagrams
Young scholars use Venn diagrams to solve prime number and factorization problems. In this multiplication lesson, students watch a video and use a Venn Diagram to help them solve a pizza math activity that uses prime factorization. Young...
CK-12 Foundation
CK-12 Middle School Math Concepts - Grade 6
Twelve chapters cover a multitude of math concepts found in the Common Core standards for sixth grade. Each title provides a brief explanation of what you will find inside the chapter—concepts from which you can click on and learn more...
Curated OER
Answer the Questions Based on Venn Diagram
In this venn diagram worksheet, learners answer five questions about ways children get to school. The venn diagram has three overlapping circles and lists three ways students may get to school (walk, bike and car).
Curated OER
Answer the Questions Based on the Venn Diagram
In this Venn diagram activity, students answer 6 questions about a Venn diagram. Students determine the number of students who like soccer and tennis.
Curated OER
Answer the Questions Based on the Venn Diagram: Deductive Reasoning
For this deductive reasoning worksheet, students answer 5 questions about a Venn diagram. Students use deductive reasoning to answer each question.
Curated OER
Working With Venn Diagrams
In this Venn Diagram worksheet, students use 2 sets of Venn Diagrams to complete a total of 5 problems. Answers are included on page 2.
Curated OER
Venn Diagrams- Help Page
In this Venn diagrams worksheet, students analyze an information sheet that features whimsical animals explaining how to use Venn diagrams. There are no problems to solve.
Curated OER
Sets and the Venn Diagram
Students review number sets and complete a Venn Diagram for number sets. In this number sets activity, students review integers, whole numbers, and elements. Students use computers to create a Venn Diagram for number sets. Students...
Curated OER
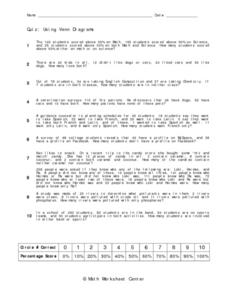
Using Venn Diagrams
In this Venn Diagrams worksheet, students complete and draw 10 different Venn Diagrams to match each problem as described. First, they determine the number of students who scored above half on math or science. Then, students compare the...
Curated OER
Shade the Venn Diagram
In this algebra worksheet, 11th graders identify what two sets of solutions have in common. They shade the given Venn diagram if the problems share common answers. There are 4 problems with an answer key.
Curated OER
Venn Diagrams
In this Venn diagrams worksheet, students look at different diagrams of sets A and B and complete problems about them. Students complete 4 problems.


