Other
Athropolis: Map of the Arctic
This is a useful map for orienting students to where the Canadian Arctic lies in relation to other Arctic countries. The centre of the map is the North Pole. Clicking on the map brings up weather reports for various locations.
NOAA
Noaa: Regional Climate Maps: Mexico
This homepage provides links to precipitation and temperature maps of Mexico.
New York Times
New York Times: Crossword Puzzle: Weather
The New York Times Learning Network has developed interactive and printable crossword puzzles. The theme of this one is weather.
Smithsonian Institution
Smithsonian Education: Tomorrow's Forecast: Oceans and Weather [Pdf]
A lesson unit for Grades 4-9 on how the ocean affects climate and weather. Includes worksheets (also in Spanish) and maps.
American Geosciences Institute
American Geosciences Institute: Earth Science Week: Mapping the Atmosphere
Pupils explore weather maps to study the atmosphere.
E-learning for Kids
E Learning for Kids: Antarctica: Penguins: What Are the Different Aspects of the Weather?
For this lesson, students learn about the different types of weather and the factors that impact them, including air pressure, humidity, sun and wind.
Science Buddies
Science Buddies: Dry Spells, Wet Spells: How Common Are They?
Here's a project that looks at what the weather was like for over a hundred years. The goal of the project is to compare long-term precipitation patterns in different regions of the country. You will work with historical climate data,...
TeachEngineering
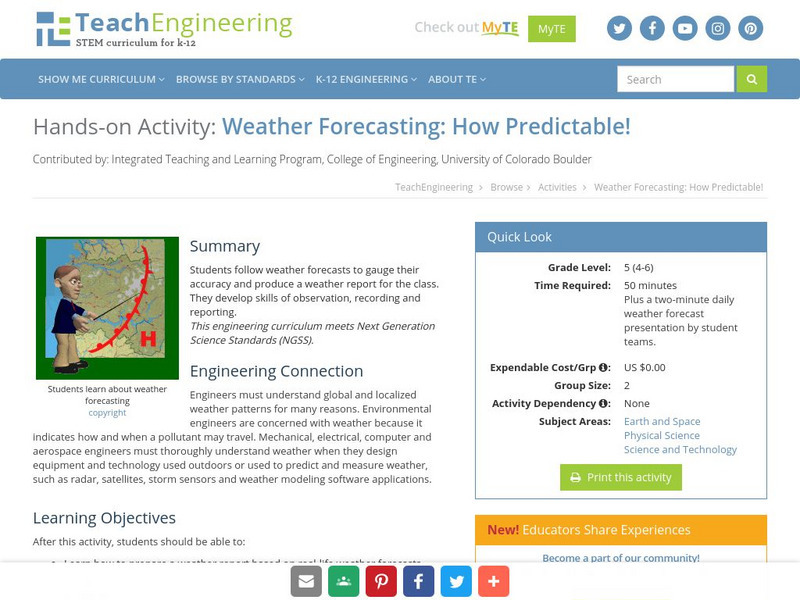
Teach Engineering: How Predictable!
Students follow weather forecasts to gauge their accuracy and produce a weather report for the class. They develop skills of observation, recording and reporting.
Wikimedia
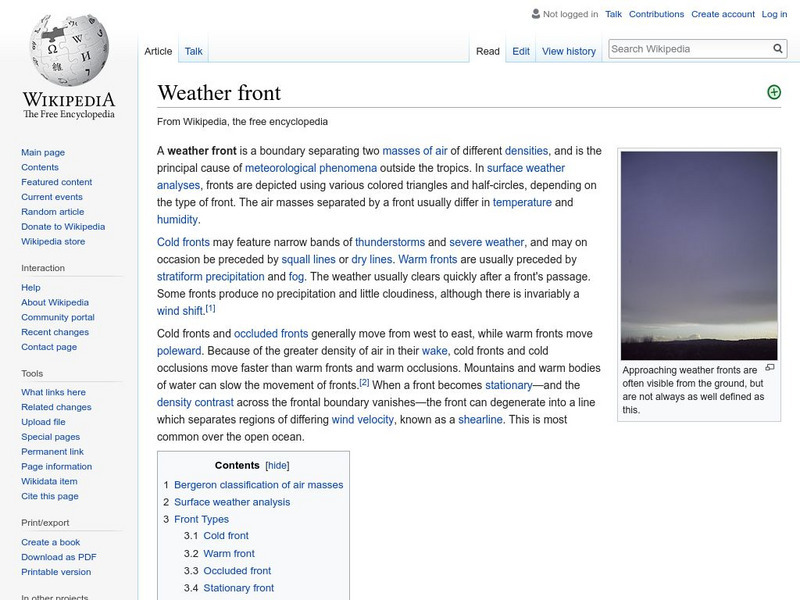
Wikipedia: Weather Front
This Wikipedia site tells all about weather fronts, or boundaries between two air masses with differing characteristics. Includes many hyperlinked terms to additional information on related subjects.
NOAA
Noaa: Ocean Explorer: Aerial Photography & Mapping Lesson Plan: Images of Katrina
This activity from NOAA Ocean Service is about using aerial photographs to assess the impact of extreme weather events such as Hurricane Katrina. The activity features aerial views of Biloxi, MS post-Katrina and enables students to see...
NOAA
Noaa: National Weather Service: Regional Climate Maps Former Soviet Union
Find weekly, monthly, and 3-month climate maps for Russia and the Former Soviet Union. Includes total precipitation and minimum and maximum temperature.
Geographyiq
Geography Iq
Detailed geographical information on any country is available at this site. Within the World Map section, you can get facts and figures about each country's geography, demographics, government, political system, flags, historical and...
Center for Innovation in Engineering and Science Education, Stevens Institute of Technology
Ciese Navigational Vectors
For this project, students use real time data to learn how pilots navigate when they fly. Students go through a series of lessons on vectors, weather maps and flight tracking, then take a pilot's test where they apply what they have...
NASA
Nasa Earth Observatory: Global Maps: Sea Surface Temperature
This global map from NASA's Earth Observatory shows the sea surface temperature from July 2002 to October 2008. Learn the influences that sea surface temperature has on climate and weather.
Science Buddies
Science Buddies: Mapping Troposhperic Ozone Levels Over Time
Ozone in the stratosphere protects the earth by absorbing harmful ultraviolet radiation from the sun. However, when ozone occurs in the troposphere, it is harmful to health. In this project you can use data from EPA monitoring stations...
Dan Satterfield
Dan's Wild Weather Page: Forecasting
Find out about the art and science of forecasting at this site from Dan's Wild Weather Page.
Geographypods
Geographypods: Theme 2: Natural Environments
A rich collection of highly engaging learning modules on topics related to the natural environment. Covers four main areas - plate tectonics, forms and processes, weather and climate, and rainforest and desert. Within each of these,...
Other
Climate Change Institute: Climate Reanalyzer
Using interfaces for reanalysis and historical station data, the Climate Reanalyzer provides an intuitive platform for visualizing a variety of weather and climate data sets and models.
Other
Paleomap: Climate History
Have you wondered what the Earth's climate was like millions of years ago? Click on a period to view a map and explanation of ancient Earth's climate.
Dan Satterfield
Dan's Wild Weather Page: Hurricanes
Use this site to find out about hurricanes and how to track them.
NOAA
Noaa: Earth System Research Laboratory: Psd: Interactive Climate Map of u.s.
Investigate climate trends across the United States by clicking on individual states and then specific cities. Data is presented from 1961-1990.
Other
Mcwdn: Maps & Globes: Landforms Mountains
Informative site about mountains. Look at the picture and read all about mountains, then take a quiz to show how much you know!
Math Graphs
Houghton Mifflin: Math Graphs: Direction and Vectors 3 [Pdf]
Students use a weather map to determine the points where the wind speed is the greatest. The resource consists of an enlarged printable version of a weather map available in PDF format.
Other
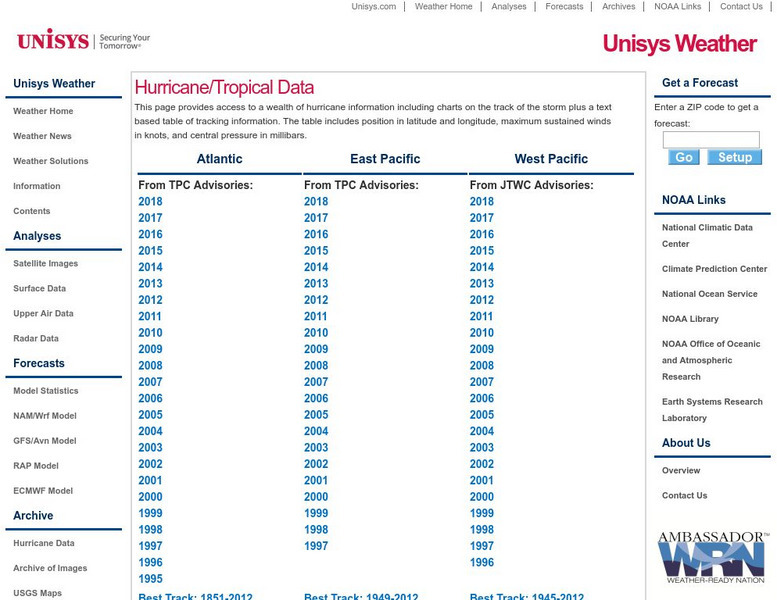
Unisys: Hurricanes/tropical Data
There is a table that has links to hurricanes in the Atlantic from 1995, East Pacific from 1997, West Pacific from 1996, South Pacific from 2000, and South India from 2000. This page has a satellite map and the Saffir-Simpson Scale.
Other popular searches
- Reading Weather Maps
- Interpreting Weather Maps
- Interpret Weather Maps
- Surface Weather Maps
- Creating Weather Maps
- Weather Maps With Fronts
- Pressure and Weather Maps
- Analyzing Weather Maps
- Construct Weather Maps
- Winds and Weather Maps
- Interactive Weather Maps
- Just Interpret Weather Maps


![Smithsonian Education: Tomorrow's Forecast: Oceans and Weather [Pdf] Unit Plan Smithsonian Education: Tomorrow's Forecast: Oceans and Weather [Pdf] Unit Plan](https://d15y2dacu3jp90.cloudfront.net/images/attachment_defaults/resource/large/FPO-knovation.png)


