Curated OER
Unit VII Energy: WS 1 Qualitative Analysis - Pie Charts
For each of eight diagrams of objects in motion, physics masters draw pie charts to depict the changes in energy. For each they must identify the energy conditions at each position. This is a unique worksheet, perfect for assessing how...
Curated OER
Solar Storm Energy and Pie Graphs
In this solar storm energy and pie graphs instructional activity, students solve 5 problems using pie graphs that show the amount of solar energy that is converted into radiation, kinetic energy, flare energy and flare energy that is...
Curated OER
Lesson 7: Smart Grids
Energy conservation is a hot topic these days; introduce your kids to the Smart Grid solution through a video clip and several interactive online tools. They discuss areas of household energy consumption, examining a pie chart...
Curated OER
Unit VII: Worksheet 4 - Energy
Energize your physics class with this energy exercise! Physics learners solve seven problems in which they calculate speed, velocity, or energy values for a variety of situations. This is a suitable homework assignment for high school...
American Museum of Natural History
What is the Greenhouse Effect?
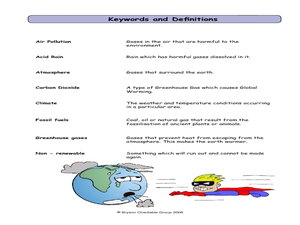
Without the greenhouse effect, Earth would not be inhabitable. A thorough online resource describes the greenhouse effect and how it occurs. The source highlights the different types of gases that work together to absorb the sun's...
Curated OER
Graph a Panther's Diet
Pupils examine the diet of panthers. In this interpreting data instructional activity, students collect data on the panther's diet and chart the data in bar and pie graphs.
Curated OER
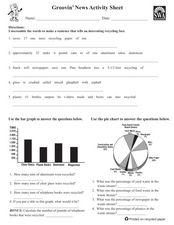
Groovin' News Activity Sheet
In these recycling worksheets, students complete several activities to learn about recycling. Students complete a word search, word scramble, bar graph, pie chart, research project, class project, and individual project for recycling.
Curated OER
Mission 5: Energy and the Environment
In these energy and environment worksheets, students learn about energy sources and the role they have with the environment. Students complete an 18 page packet for the activity.
Curated OER
Thinking About Technology: What Is It? How Can It Help Us?
What is technology and how can it help us? Using a worksheet, students read a list and choose practical applications of scientific knowledge, brainstorm examples of home, school and hospital technology, graph answers in a pie chart, and...
World Wildlife Fund
Land of the Midnight Sun
From days of 24 hour sunlight, to endless nights that last for days, the Arctic is a very unique place to live. Examine the seasonal changes that occur in the northern-most reaches of the globe and the impact they have on the plants and...
Curated OER
Grasping Graphs
In this grasping graphs worksheet, students solve and complete 3 different types of problems. First, they graph the data described and select the appropriate graph type. Then, students identify the independent and dependent variable. In...
Curated OER
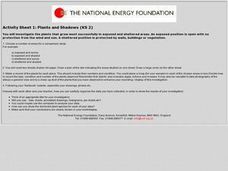
Plants and Shadows
In this science worksheet, students design an experiment to measure the effects of sunlight exposure upon plants while comparing the amount of shade as a correlation.
Curated OER
A Look at the Life That Electronics Lead
In this comprehension worksheet, learners fill in ways on a graphic organizer that people or companies can conserve energy, reduce waste or minimize the impact to the environment. Next, students solve 3 "environmental" math word problems.
Curated OER
Constant Net Force
In this forces worksheet, students calculate life force, acceleration, and displacement for 8 word problems. Students must label force diagram and a summation force model.
Curated OER
Oh Panther
Learners play a game that replicates the balance of prey and predators in an ecosystem. In this physical education lesson plan, students follow the instructions to play "Oh Panther!" Learners collect data regarding the game and discuss...
Curated OER
Animal Masks
Learners design and make animal masks. In this research and application lesson, students use a computer to research what a panther eats, select an animal mask they want to make and then use the materials provided to create their...
Curated OER
Informational Reading: Electronics Are Made from Resources
In this comprehension worksheet, students read about the making of a computer: circuit boards, hard drives, monitors and plastic housings. Students then answer 3 multiples choice questions.
Curated OER
Technology has a Solution!
In this technology worksheet, students summarize four things they learned about technology and the environment. Students then write a report that outlines how technology is solving environmental issues.
Curated OER
Calorie Connection
Students calculate the calories in a Brazil nut and the calories needed for daily intake. In this calories lesson plan, students use calorimetry to measure the change in water temperature heated by the burning of a Brazil nut. They also...
Curated OER
Enzymatic Action
Students observe how a cell uses an enzyme to rid itself of a poisonous substance by experimenting with hydrogen peroxide, potatoes, liver and carrots. They record the temperature and changes of the hydrogen peroxide as other elements...
PBS
Pbs Learning Media: Energy in a Roller Coaster Ride
This interactive roller coaster ride produced for Teacher's Domain illustrates the relationship between potential and kinetic energy. As the coaster cars go up and down the hills and around the loop of the track, a pie chart shows...
US Department of Energy
United States Department of Energy: Power Metering Project
Two part instructional activity focuses on applying analytic tools such as pie charts and bar graphs to gain a better understanding of practical energy use issues. Students will learn how different types of data collected affect the...


