Curated OER
Survey Says...
Young statisticians collect, organize, and present data to illustrate responses to a survey question. They write and conduct the survey. They finish by presenting the results in the form of a graph.
Curated OER
Show Me The Data!
Pupils create a bar graph. They will collect and organize data to turn into bar graphs. They create graphs for the favorite sports of the class, color of M&M's, and types of cars passing by.
Curated OER
Survey Says...
Young learners create and implement a school-wide survey about student body favorites! Learners record and analyze the data on a bar graph, picture graph, and line graph, and then display the data. Then, wrap it all up with a celebration...
Curated OER
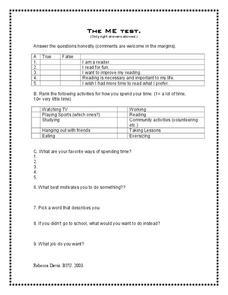
The Lion, the Witch and the Wardrobe: Me Test
Get to know your scholars with this in-depth survey that asks learners to rate, answer true or false, write short answers, and draw abstract visuals about their academic and personal preferences.
Curated OER
What Sport Do You Like To Play the Most?== Class Bar Graph
In this math worksheet, students participate in making a group bar graph about their favorite sports. Students are surveyed and the responses plotted on a graph.
Curated OER
Collect and Organize Data - Practice 14.1
In this data collection worksheet, students read the word problem and study the tally chart about favorite sports. Students then use the information in the chart to answer the questions. Students then use the list about students'...
Curated OER
Breaking News English: Adidas Agrees to Buy Rival Reebok
In this ESL worksheet, students first read or listen to a text about the Adidas and Reebok companies. Students complete 8 pages of comprehension exercises. Included are vocabulary, questions, completing sentences, discussion, problem and...
Curated OER
Attitude and Interest Survey
For this attitude and interest survey, learners answer questions about home, school, friends, favorites and miscellaneous. A website reference for additional resources is given.
Curated OER
How does Physical activity Help You?
Examine factors that influence your choice about physical activity. In this physical activity lesson, students recognize how physical activity and good health go together. Students participate in a survey about physical activity and...
Curated OER
Circle Graphs
In this circle graphs worksheet, students solve 10 different problems that include reading various circle graphs. First, they use graph 1 to determine how many students preferred which sport. Then, students use graph 2 to determine the...
Curated OER
Students Information And Interest Survey
In this personal information worksheet, students fill out this form to give details about their personal history, prior experiences and preferences. This could be used for information gathering or as an icebreaker activity.
Math Moves U
Collecting and Working with Data
Add to your collection of math resources with this extensive series of data analysis worksheets. Whether your teaching how to use frequency tables and tally charts to collect and organize data, or introducing young mathematicians to pie...
Great Schools
A Questionnaire: What Do You Like to Read?
What do your fifth graders know about types of fiction, nonfiction, and poetry? Find out as they fill out this questionnaire that requires them to list authors and texts that exemplify each genre. Not only will you be able to assess what...
Curated OER
Data collection and analysis
In this probability and statistics activity, high schoolers determine when a survey or collected data could be biased. The one page activity contains a combination of three multiple choice and free response questions. Answers are...
Curated OER
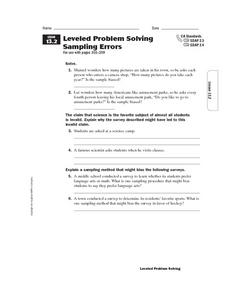
Leveled Problem Solving Sampling Errors
In this sampling errors worksheet, students problem solve to find the sampling errors for each word problem. Students finish by finding a sampling method that might bias the last surveys.
Curated OER
And Around We Go!
Sixth graders conduct a survey and collect data to construct a bar graph that will then be changed into a circle graph. With the bar graph, 6th graders compare estimated fractions and percentages and estimate percentages. With the circle...
Curated OER
Going with the Flow
Students survey each other and determine their common interests. They examine the use of algorithms by various websites that are used to develop networks of interest groups among users. They then design proposals for a social networking...
Raytheon
Data Analysis and Interpretation
For this data analysis and interpretation worksheet, learners use charts, graphs, statistics to solve 42 pages of problems with answer key included.
Curated OER
The Average Kid
Students determine the traits they have in common with other students in the class and create visual profiles of the "average" boy and the "average" girl.
Curated OER
Getting to Know Your Students
Getting to know your students is an experience that can be fun and enjoyable.
Lesson Plans
Student Info
Inform your instruction with information about your pupils. These student information pages will help you gather data about your classes. The first page focuses on educational history and preferences and the second asks for contact...
Curated OER
Conditional Probability
In this conditional probability worksheet, students determine compound probability of dependent events. This one-page worksheet contains ten problems.
Curated OER
Answer the Questions Based on the Venn Diagram
In this Venn diagram worksheet, students answer 6 questions about a Venn diagram. Students determine the number of students who like soccer and tennis.
Curated OER
Collecting Data and Graphing
Eighth graders, in groups, count the different colors of M&M's in each kind of package and then draw a pictograph to show the results. Each group writes a program to show their results and then compare the manually-drawn and computer...


