Curated OER
Making Predictions About Measurement
Upper graders experiment with measurement. They estimate the length, volume, and weight of various objects, then rotate through stations making predictions concerning measurements and then testing their predictions.
Curated OER
Calculator Tricks: The Golden Prediction
Excite the class with a mathematical trick, a calculator, and a good number sense. They use the directions provided on each slide to make a list of numbers, use their calculator to divide, and find the golden mean. A little history on...
Curated OER
The Barbie Bungee Drop
What do math, bungee jumping, and Barbie® have in common? Young adventure seekers use rubber bands as bungee cords to predict a thrilling, but safe, jump for their doll. First, test jumps are conducted with a few rubber bands. Then more...
EngageNY
Modeling Relationships with a Line
What linear equation will fit this data, and how close is it? Through discussion and partner work, young mathematicians learn the procedure to determine a regression line in order to make predictions from the data.
Under the Dome
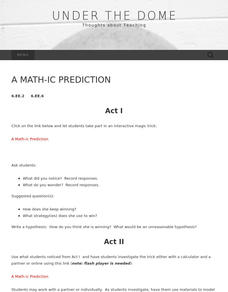
A Math-ic Prediction
Trick out mathematical expressions. Scholars participate in a computerized magic trick where the computer guesses the final answer to a series of operations. Pupils investigate the trick to determine what is happening. Individuals then...
Curated OER
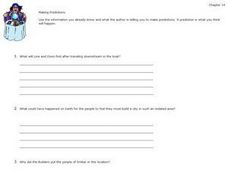
Making Predictions
Students explore the concept of probabiility and outcome through several decision making activities. Making accurate predictions in daily life including weather forecasting, stock market selections, or job changes are all dependent on...
Curated OER
Twelve Days of Christmas--Prediction, Estimation, Addition, Table and Chart
Scholars explore graphing. They will listen to and sing "The Twelve Days of Christmas" and estimate how many gifts were mentioned in the song. Then complete a data chart representing each gift given in the song. They also construct...
Curated OER
Meteorological Predictions
Pupils make a link between prediction and hypothesis in math and science. Based on data collected over one week, students evaluate the predictions of local weather forecasters, compare the predicted outcomes to the actual weather...
EngageNY
Using Linear Models in a Data Context
Practice using linear models to answer a question of interest. The 12th installment of a 16-part module combines many of the skills from previous lessons. It has scholars draw scatter plots and trend lines, develop linear models, and...
EngageNY
Informally Fitting a Line
Discover how trend lines can be useful in understanding relationships between variables with a lesson that covers how to informally fit a trend line to model a relationship given in a scatter plot. Scholars use the trend line to make...
EngageNY
Calculating Conditional Probabilities and Evaluating Independence Using Two-Way Tables (part 2)
Without data, all you are is another person with an opinion. Show learners the power of statistics and probability in making conclusions and predictions. Using two-way frequency tables, learners determine independence by analyzing...
EngageNY
Normal Distributions (part 2)
From z-scores to probability. Learners put together the concepts from the previous lessons to determine the probability of a given range of outcomes. They make predictions and interpret them in the context of the problem.
EngageNY
Interpreting Residuals from a Line
What does an animal's gestation period have to do with its longevity? Use residuals to determine the prediction errors based upon a least-square regression line. This second lesson on residuals shows how to use residuals to create a...
Achieve
Ivy Smith Grows Up
Babies grow at an incredible rate! Demonstrate how to model growth using a linear function. Learners build the function from two data points, and then use the function to make predictions.
Pennsylvania Department of Education
What is the Chance?
Fourth and fifth graders make predictions using data. In this analyzing data activity, pupils use experimental data, frequency tables, and line plots to look for patterns in the data in order to determine chance. You will need to make a...
American Statistical Association
Scatter It! (Predict Billy’s Height)
How do doctors predict a child's future height? Scholars use one case study to determine the height of a child two years into the future. They graph the given data, determine the line of best fit, and use that to estimate the height in...
EngageNY
Modeling with Polynomials—An Introduction (part 2)
Linear, quadratic, and now cubic functions can model real-life patterns. High schoolers create cubic regression equations to model different scenarios. They then use the regression equations to make predictions.
MENSA Education & Research Foundation
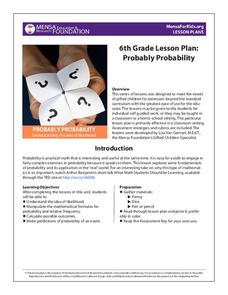
Probably Probability
Reinforce the concept of probability with a series of lessons highlighting the idea of likelihood, probability formulas, relative frequency, outcomes, and event predictions. The collection is made up of four lessons offering informative...
American Statistical Association
Scatter It! (Using Census Results to Help Predict Melissa’s Height)
Pupils use the provided census data to guess the future height of a child. They organize and plot the data, solve for the line of best fit, and determine the likely height and range for a specific age.
PBL Pathways
Students and Teachers
Predict the future of education through a mathematical analysis. Using a project-based learning strategy, classes examine the pattern of student-to-teacher ratios over a period of years. Provided with the relevant data, learners create a...
Curated OER
When Will We Ever Use This? Predicting Using Graphs
Here are a set of graphing lessons that have a real-world business focus. Math skills include creating a scatter plot or line graph, fitting a line to a scatter plot, and making predictions. These lessons are aimed at an algebra 1...
Curated OER
High School Mathematics Problems from Alaska: Predicting Plant Coverage
Students participate in simulation as they examine vegetation in a square meter land plot. Students construct charts and a key to make predicitons about other land plots.
Curated OER
Bubbles Galore
Learners investigate bubbles. In this science lesson, students observe how long bubbles last and graph the results of the experiment.
Virginia Department of Education
Linear Curve of Best Fit
Is foot length to forearm length a linear association? The class collects data of fellow scholars' foot length and the length of their forearms. They plot the data and find a line of best fit. Using that line, they make predictions of...


