Curated OER
Measure and Color
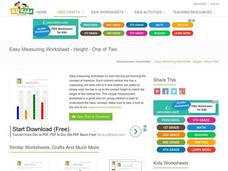
In this nonstandard measurement worksheet, young mathematicians look at the height of each of four lines, then color in the measurement bars up to the right height to match each line.
Curated OER
Measure the Pencils
Excellent measuring practice is here in this math worksheet. Learners cut out the measuring bar at the bottom of the page and use it to measure four pencils. This is nonstandard measurement.
Curated OER
Measure Length
An excellent worksheet on measurement is here. Young learners cut out the measuring bar at the bottom of the page and measure five lines, then write how many boxes long each line is.
Education.com
Measure School Supplies
Ever wonder how long a pair of scissors are? Find out with this simple measuring activity in which pupils use the provided ruler to determine the length of four common classroom supplies.
Scholastic
Study Jams! Bar Graphs
Mia teaches Sam how to create a bar graph, including forming a title, creating and labeling the axes, choosing a scale, and entering data. After viewing, data analysts can test themselves with seven follow-up questions and review...
Curated OER
Can You Measure Up?
Here is a well-designed lesson on common standards of measurement for your young mathematicians. In it, learners calculate measurements in standard and non-standard units. They make predictions, record data, and construct and design...
Curated OER
Reading Bar Graphs #2
Raise the bar in your third grade class with this learning exercise on bar graphs. Youngsters view three graphs representing three different sets of data, and answer questions based on what they analyze. The first set is completed as an...
Curated OER
Lesson #46: Bar Graphs and Line Graphs
In this bar graphs and line graphs worksheet, students interpret bar graphs, line graphs, and box-and-whisker plots. They find the measures of central tendency. This three-page worksheet contains notes, vocabulary, and approximately 10...
Curated OER
Reading Bar Graphs
Working on bar graphs in your math class? Use a thorough worksheet to reinforce graphing and problem solving skills with your third graders. After reviewing two bar graphs, young learners answer ten questions about the data represented...
Houghton Mifflin Harcourt
Use a Graph: Measure Fish
Something's fishy here! Use the bar graph provided to determine the length of each fish shown. Small cartoon fish make this an engaging learning exercise for young learners. There are six questions provided.
Curated OER
Candy Bar Measurements
Geometers explore mathematics by completing an object measurement worksheet. They utilize a variety of candy bars and rulers to conduct a measurement experiment in class. They complete worksheets as a group based on the measurement...
Curated OER
How to Draw a Bar Chart Correctly
Your class has gathered their data, so what's the next step? They need to display and analyze their data, and a bar chart is a perfect tool for the job. This resource provides the step-by-step instructions those kids need to construct a...
Curated OER
Generate Measurement Data Word Problems
Bar and line graphs are an excellent way to visually analyze data: give your scholars practice both analyzing graphs and creating their own! First, they examine five basic bar graphs, indicating the number of squares on specific days....
Curated OER
Generate Measurement Data Word Problems
Beginning graphers will appreciate this practice with basic bar graphs. For each table of data, there is a corresponding graph for learners to match it to. The five data sets all have the same two factors: days and numbers. Although this...
Curated OER
Tree Measurement
Measure a tree? Yes, measure a tree! Students get outside and measure a tree's trunk, crown, and height. Each group compares their answers to determine if any re-measuring is necessary. Once back in the classroom, students make bar...
Curated OER
Measurements - Franklin College
Second graders review measurements in inches and practice measuring different objects. As a class, they estimate various objects in their classroom and compare their estimation to the actual measurement. To end the lesson, they complete...
Curated OER
Measure the Length
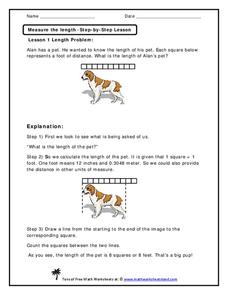
Practice measurements with your scholars using this word problem. Because the answer is explained at the bottom of the page, this would work best as an all-class warm up. Cover up the answers until after kids have shared responses. They...
Curated OER
Measuring Mixed Numbers
Mixed numbers can be added conceptually, algorithmically, and physically. Have the class visualize mixed numbers by adding fraction bars together. They then discover the algorithmic process that simplifies adding mixed numbers. Finally,...
Curated OER
Using Your Marbles - Volume Measurement and Reporting
Demonstrate how to measure the volume of liquids and solids immersed in liquid to your class. They observe a teacher-led demonstration, and in small groups construct a data table that demonstrates how many marbles were used and the...
Curated OER
Math Investigations 2
Young mathematicians practice measuring and graphing skills while working in groups to measure objects found in the classroom. Using their measurements, they create one bar graph displaying the lengths and another displaying the widths.
Curated OER
Introduction to Representing and Analyzing Data
Represent data graphically. Allow your class to explore different methods of representing data. They create foldables, sing songs, and play a dice game to reinforce the measures of central tendency.
Captain Planet Foundation
Shape Shifters in the Math Garden
Combines mathematical measurement with gardening skills. Third graders hunt for worms in the garden and try to find the longest one. They also measure and weigh vegetables that they harvest from the garden, measure rainfall amounts, and...
Curated OER
Measure the Lines
For this measurement worksheet, students cut out a measuring bar and use it to measure and color given lengths. Worksheet has a reference web site for additional activities.
Curated OER
Measure and Color
In this measurement worksheet, students solve 4 problems that require them to color measurement bars to the appropriate lengths.


