Curated OER
Character Analysis and The Crucible
Readers of The Crucible use a SATDO chart to collect evidence they will use to craft interpretive statements and an analysis of one of Miller’s characters. Background information on the play and about Miller, links to handouts,...
Curated OER
Introduction to Representing and Analyzing Data
Represent data graphically. Allow your class to explore different methods of representing data. They create foldables, sing songs, and play a dice game to reinforce the measures of central tendency.
Curated OER
What Can Data Tell Us?
Young scholars explore data distribution. In this data analysis instructional activity, students create a data distribution table by playing the game "Tower of Hanoi" from the Hall of Science. Young scholars analyze their data and answer...
Math Moves U
Collecting and Working with Data
Add to your collection of math resources with this extensive series of data analysis worksheets. Whether your teaching how to use frequency tables and tally charts to collect and organize data, or introducing young mathematicians to pie...
CK-12 Foundation
Graphs for Discrete and for Continuous Data: Discrete vs. Continuous Data
Not all data is the same. Using the interactive, pupils compare data represented in two different ways. The learners develop an understanding of the difference between discrete and continuous data and the different ways to represent each...
Curated OER
Penny Basketball: Making Sense of Data
Explore four web-based interactive sites to develop a baseline understanding of statistics. Learners play a series of penny basketball games and collect data regarding their shooting statistics. Groups decide who is the "top" penny...
Curated OER
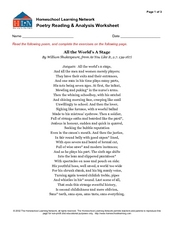
Poetry Reading and Analysis Worksheet - As You Like It
Enhance your lesson on Shakespeare with this poetry activity. After reading lines 139-167 from As You Like It Act II, Scene 7 (provided on the first page), middle schoolers work on a graphic organizer to paraphrase each part of the poem....
Curated OER
Data Analysis and Probability: Graphing Candy with Excel
Collect and graph data using Microsoft Excel with your math class. They will make predictions about the number of each colored candy in a bag of M&M's, then sort, classify, count, and record the actual data before using Excel to...
CK-12 Foundation
Types of Data Representation: Baby Due Date Histogram
Histograms are likely to give birth to a variety of conclusions. Given the likelihood a woman is to give birth after a certain number of weeks, pupils create a histogram. The scholars use the histogram to analyze the data and answer...
Curated OER
Literary Analysis: Summary vs. Analysis
What is the difference between summary writing and literary analysis? A 16-slide presentation offers some basic requirements for both types of writing and helps readers identify each based on keywords used in both types of writing....
Curated OER
Character Analysis Chart
This versatile graphic organizer could be used alongside any novel, poem, play, or story through which your class in studying character. Class members can get characters straight or describe particular characters in more detail with this...
Curated OER
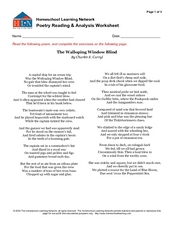
Poetry Reading: Analysis Worksheet
Explore poetry by reading the poem "The Walloping Window Blind" by Charles E. Carryl, and completing an analysis with your class. The worksheet provides the entire poem, a graphic organizer to help with summarizing and paraphrasing, and...
Curated OER
The New York City Draft Riots: A Role Play
This is a fun, thought-provoking lesson. Learners use census data from 1855, primary source documents, their historical knowledge, and information regarding the New York City Draft Riots of 1863 to construct and engage in a role-play....
Curated OER
Reformers versus Residents in Five Points: A Role Play
Social Studies and role-playing can go hand in hand. Learners use supporting evidence found in primary and secondary source material to develop a character from the Five Points neighborhood in the 1850s. Each student takes on the role of...
Brigham Young University
Introducing the Text and Learning the Process of Script Analysis
Where do directors and set designers get their ideas so that the set they build creates the mood and atmosphere the director wants for a production? From the script! Introduce theater high schoolers to the script analysis techniques used...
Curated OER
Rosencrantz and Guildenstern Are Dead: Concept Analysis
Make sure you are well-informed before embarking on a study of Rosencrantz and Guildenstern Are Dead. This resource includes an analysis of the text that a teacher can use to prepare a unit of study. It covers plot elements, themes,...
Omaha Zoo
I Like to Move It
What do lemurs do best? They move! Lemurs like to jump, run, hop, and climb and it's your class's job to document seven fun lemur behaviors. The class starts by discussing why lemurs are considered primates, and then they isolate seven...
Curated OER
"Playing in the Snow" - Reading Comprehension (Poem)
Have your English language learners puzzle through this activity. Class members read the incomplete poem about playing in the snow and use the given words to complete poem. This is challenging since some of the spaces are ambiguous. Ask...
Curated OER
Twelfth Night Act 3 Sc 4
Young scholars complete analysis activities for the Shakespearean play, Twelfth Night. In this play analysis lesson, students review a summary of the Twelfth Night, complete journal prompt writings, and a scene blocking activity. Young...
Curated OER
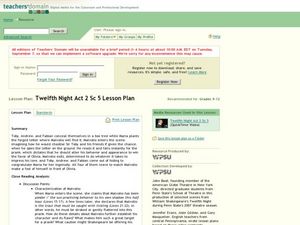
Twelfth Night Act 2 Scene 5 Lesson Plan
Students read and complete activities for the Shakespeare play Twelfth Night. For this play analysis lesson, students discuss the themes, characters, and literary devices used in Act 2, Scene 5 of the Twelfth Night. Students complete a...
CK-12 Foundation
Data Summary and Presentation: Chart for Grouping Data
Get social! Create a display of social media use for a class. Pupils use provided information about the time spent on social media to construct a histogram. Using the histogram, learners interpret the data to answer questions.
CK-12 Foundation
Line Graphs to Display Data Over Time: Strawberry Competition
Take the tediousness out of graphing. Using the interactive tool, learners can efficiently create a line graph from a set of data. They then use the graph to answer questions about specific trends in the data.
Curated OER
Literary Response and Analysis
Students analyze the archetype of 'the fall' in Shakespeare's Macbeth. In this literary analysis lesson, students work in tiered learning groups to analyze the characters of Macbeth and Lady Macbeth. Students use the book of Genesis as...
Curated OER
Play It
There are a number of activities here that look at representing data in different ways. One activity, has young data analysts conduct a class survey regarding a new radio station, summarize a data set, and use central tendencies to...
Other popular searches
- Anne Frank Play Analysis
- Drama Play Analysis
- Literature: Play Analysis
- Students Play Analysis
- Character and Play Analysis
- Play Analysis Ideas


