Curated OER
Unit II: Worksheet 3 - Velocity
Future engineers analyze the motion of Robin, the roller skater, as he moves along a sidewalk. They graph the position versus time for three different occurrences. Questions are asked about the resulting graphs, reinforcing the concepts...
Curated OER
Unit II: Worksheet 1 - Velocity
Beginning physics scholars interpret two graphs depicting position versus time. For each graph, there is a series of questions to answer. The exercise is basic, but beneficial. Consider using it as an assessment of understanding after...
Urbana School District
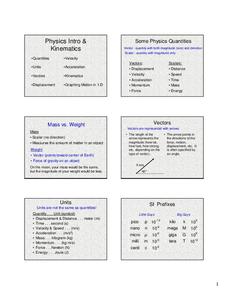
Physics Intro, Kinematics, Graphing
Some consider physics the branch of science concerned with using long and complicated formulas to describe how a ball rolls. This presentation, while long, is not complicated, yet it covers rolling, falling, and more. It compares vectors...
Curated OER
Velocity and Acceleration
Compliment your physics lesson with this PowerPoint which demonstrates many important points regarding acceleration and velocity. A starter experiment activity to stimulate student thinking is given, and may prove very interesting to a...
Physics Classroom
Position-Time Graphs - Conceptual Analysis
Increasingly, colleges and employers want applicants with strong conceptual analysis skills, so give them some practice! Applying these skills to position-time graphs encourages synthesis of knowledge. To complete an installment of a...
Curated OER
Acceleration and Average Speed
In this acceleration and average speed worksheet, students learn the equations for acceleration and average speed. They match 6 variables with their quantities, they identify speed vs. velocity and scalar vs. vector and they solve 4...
Curated OER
Calculus 10.2 day 2 - Vector Valued Functions
Looking for a lesson on vectors? Here is a PowerPoint that has six examples for finding velocity, acceleration, speed and direction of motion. One of the examples demonstrates the use of the TI-89 Graphing Calculator to solve a problem.
Curated OER
Speed
Fifth and sixth graders practice working in pairs to determine whether they can walk with constant speed. They test themselves, collect their data, draw graphs with their data collected, manipulate the data, and then draw conclusions...
Curated OER
Unit II: Worksheet 2 - Velocity vs. Time Graphs
On the first of two pages, physics aces graph velocity versus time on sets of axes. On the second page, they look at graphs of position versus time and then draw velocity versus time on graphs right next to them. This is good practice in...
Curated OER
Worksheet 2: Graphs, Functions and Derivatives
In this math worksheet, students answer 7 questions having to do with graphing derivatives of functions, rectilinear motion, speed and distance.
Curated OER
Worksheet 3: Graphing Speed and Time
In this graphing speed and time worksheet, learners answer 7 questions regarding graphing, speed, distance, derivatives, Newton's method and wheel radius.
Curated OER
Graphing Linear Motion
In this graphing linear motion worksheet, learners answer 20 questions about velocity of objects, the distance they travel and the time. They interpret a graph of position vs. time and identify the velocity at certain point on the graph.
Curated OER
Regents High School Examination - Physics 2010
Give every type of learner in your physics class an opportunity to demonstrate what they have learned throughout the year. From analyzing tables and graphs, to evaluating diagrams and solving problems, there is an outstanding variety of...
Curated OER
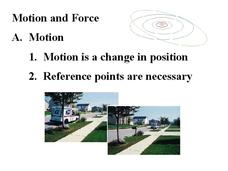
Motion and Force
All the main concepts in motion and force are covered in this presentation. Each slide is a great summary and will appeal to your students with a clean design and images that should seem relevant. Definitions of speed, displacement,...
Curated OER
"Graphing Your Motion"
Students study the concepts of motion, velocity, and acceleration through graphing their own movement using LoggerPro. They explain the difference between speed and velocity using the weather vane example. They discover the difference...
Curated OER
Position, Velocity & Acceleration vs. Time Graphs
In this motion activity, students use a graph showing velocity vs. time to create a speed vs. time graph and an acceleration vs. time graph. Students label all critical values along the y-axis.
Kenan Fellows
Analyzing Speed from Different Modalities
Show us your moves. Using sensor equipment, scholars track the motion of different movements, such as jogging, skipping, or jump roping. They analyze velocity and acceleration and create graphs representing each movement.
Curated OER
Linear Motion: Speed, Velocity & Acceleration
Learners explore the concept of linear motion. For this linear motion lesson, students calculate distance and time in order to calculate average speed and velocity in the provided problems.
Illustrative Mathematics
Velocity vs. Distance
At the end of this activity, your number crunchers will have a better understanding as to how to describe graphs of velocity versus time and distance versus time. It is easy for learners to misinterpret graphs of velocity, so have them...
Curated OER
Motion: Speed, Velocity, Acceleration and Networking
Students interpret a variety of motion graphs. In this physics lesson, students calculate the speed and acceleration of objects using numerical data from graphs. They apply what they have learned to solve real world problems.
Bowels Physics
Graphical Analysis
Assist your class in learning graphical analysis by reviewing the slide presentation. Class members review 15 slides to further understand concepts such as velocity and acceleration. They conclude with practice problems related to the...
Curated OER
Position, Velocity & Acceleration vs. Time
For this motion worksheet, students use a graph showing the velocity of an object over time to describe the motion of the object and to determine the position of the object at different intervals. Then students create speed vs. time and...
Curated OER
Position and Velocity vs. Time Graphs
In this position and velocity learning exercise, students sketch graphs of position vs. velocity and position vs. time for 6 problems given different scenarios. They label their graphs with given positions, velocities and times.
Curated OER
Velocity
In this pre-calculus learning exercise, students calculate the velocity of a linear graph by observing the slope of a line. There are 10 velocity questions.


