Virginia Department of Education
z-Scores
Just how far away from the mean is the data point? Pupils calculate the standard deviation for a set of data and find out how many standard deviations a point is away from the mean. The teacher leads a discussion on how to calculate...
Curated OER
Z-Scores
Learners solve problems by identifying the percent of area under the curve. In this statistics lesson, students discuss z-scores as they calculate the different percentages under the bell curve. They calculate the standard deviation.
College Board
2011 AP® Statistics Free-Response Questions
Familiarize yourself with the AP® exam by looking at past tests. A PDF file provides the 2011 AP® Statistics free-response questions. The questions include topics such as mean, standard deviation, conditional probability, sampling...
Virginia Department of Education
Analyzing and Interpreting Statistics
Use measures of variance to compare and analyze data sets. Pupils match histograms of data sets to their respective statistical measures. They then use calculated statistics to further analyze groups of data and use the results to make...
Mathematics Vision Project
Module 8: Statistics
What does it mean to be normal in the world of statistics? Pupils first explore the meaning of a normal distribution in the eight-lesson module. They then apply the statistics related to normal distributions such as mean, standard...
College Board
2011 AP® Statistics Free-Response Questions Form B
Is the sequel better than the original? The 2011 AP® Statistics free-response questions, Form B, is available for instructors to reference. Among the topics covered in the exam are histograms, distributions, studies and experiments,...
Radford University
Big Future - How SAT Scores Play a Role in College Acceptance
Understanding the importance of SAT scores is as easy as ABC. A set of three statistics lessons teaches scholars about normal distributions, the Empirical Rule, and z-scores. They apply their newfound knowledge to investigate data...
College Board
2016 AP® Statistics Free-Response Questions
Test your classes on their knowledge of advanced statistic concepts. Young math scholars get a sneak peek at the end of course AP® statistics exam with the released items from the 2016 test. The six-question free response exam addresses...
Virginia Department of Education
Exploring Statistics
Collect and analyze data to find out something interesting about classmates. Groups devise a statistical question and collect data from their group members. Individuals then create a display of their data and calculate descriptive...
Virginia Department of Education
Normal Distributions
Pupils work to find probabilities by using areas under the normal curve. Groups work to calculate z-scores and solve real-world problems using the empirical rule or tables.
EngageNY
Normal Distributions (part 2)
From z-scores to probability. Learners put together the concepts from the previous lessons to determine the probability of a given range of outcomes. They make predictions and interpret them in the context of the problem.
Radford University
Are Kitchen Cabinets at the Correct Height? Lessons 1-5
Here's a not-so-normal unit on normal heights. Future statisticians anonymously collect class data on female heights, weights, and shoe sizes. They then analyze the data using normal distributions, z-scores, percentiles, and the...
Mathematics Vision Project
Module 9: Statistics
All disciplines use data! A seven-lesson unit teaches learners the basics of analyzing all types of data. The unit begins with a study of the shape of data displays and the analysis of a normal distribution. Later lessons discuss the...
Curated OER
Transforming Univariate Data
Learners analyze plotted data in this statistics activity. They differentiate between skewed and normal data. They also explore and interconnect exponential growth and decay as it relates to the data.
Curated OER
Statistics: Final Exam Review
For this statistics and probability worksheet, students are provided with a review of the final exam in statistics. The three page worksheet contains a combination of six multiple choice and free response questions. Answers...
Curated OER
Confidence Intervals: Population Mean; Population standard Deviation Known
In this confidence interval worksheet, students examine a given confidence level and sample data to determine the margin of error, identify a confidence interval, list the mean and give the standard deviation. Students complete seven...
Curated OER
Discovering Advanced Algebra More Practice Your Skills, Lessons 11.1-11.6
For this six page series of worksheet, learners answer short answer questions about a variety of topics. The six topics covered in this packet are: Experimental Design (4 questions), Probability Distributions (3 multiple choice...
Virginia Department of Education
Calculating Measures of Dispersion
Double the fun — calculate two measures of deviation. The lesson plan provides information to lead the class through the process of calculating the mean absolute deviation and the standard deviation of a data set. After learning how to...
Khan Academy
Khan Academy: Z Scores 1
Find the z-score of a particular measurement given the mean and standard deviation. Students receive immediate feedback and have the opportunity to try questions repeatedly, watch a video or receive hints.
University of Colorado
University of Colorado: Z Scores Applet
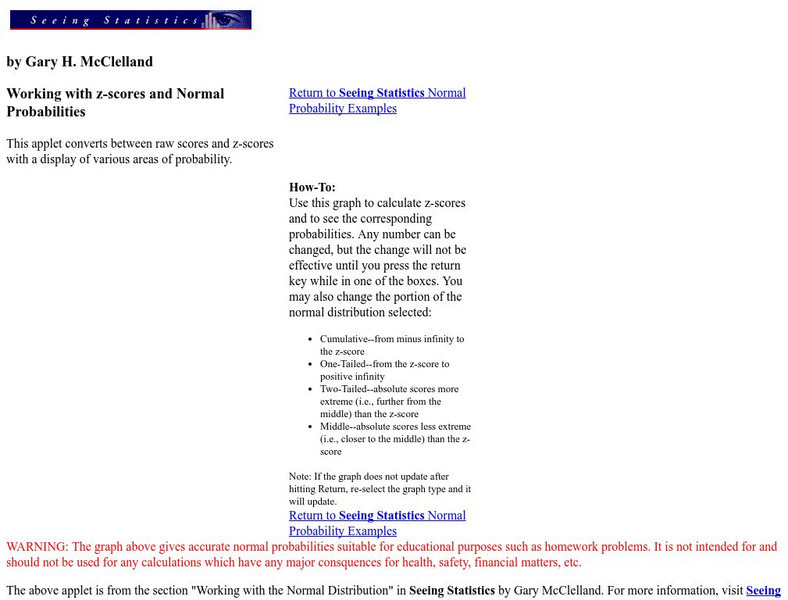
The Applet assists the user in questions which specify a probability and ask for the relevant range of raw scores or z scores. The program will also transform from raw to z scores and back again, if needed.
Other
Magoosh: Statistics Fundamentals
An online course on the fundamentals of statistics including video lessons in Mean, Median, and Mode; Weighted Averages; Quartiles and Boxplots; Range and Standard Deviation; Normal Distribution; Z-scores; Intro to Inferential...
Other
Fayetteville State University: Z Scores and Probability
Several paragraphs of explanation and graphs are found here to get across the concept of normal scores, z-scores, and the related probability in a simple fashion. This page is part of a collection from the university on basic statistical...
Other
Fayetteville State University: Z Distributions
The introductory paragraph explains Z-Distributions, their spread, and the ability to find certain values within the distribution. Two animated graphs are then provided as an example of the probability of the normal distribution curve.


